Get Started With Allocation Profiling
Other languages: Español Français Deutsch 日本語 한국어 Português 中文
We often find ourselves in situations when code is not working properly, and we have no idea where to even begin investigating.
Can’t we just stare at the code until the solution eventually comes to us? Sure, but this method probably won’t work without deep knowledge of the project and a lot of mental effort. A smarter approach would be to use the tools you have at hand. They can point you in the right direction.

In this post, we’ll look at how we can profile memory allocations to solve a runtime problem.
The problem
Let’s start with cloning the following repository: https://github.com/flounder4130/party-parrot.
Launch the application using the Parrot run configuration included with the project. The app seems to work well: you can tweak the animation color and speed. However, it’s not long before things start going wrong.

After working for some time, the animation freezes with no indication of what the cause is.
The program can sometimes throw an OutOfMemoryError , whose stack trace doesn’t tell us anything about the origin of the problem.
There is no reliable way of telling how exactly the problem will manifest itself. The interesting thing about this animation freeze is that we can still use the rest of the UI after it happens.

I used Amazon Corretto 11 for running this app. The result may differ on other JVMs or even on the same JVM if it uses a different configuration.
The debugger
It seems we have a bug. Let’s try using the debugger! Launch the application in debug mode, wait until the animation freezes, then hit Pause Program.
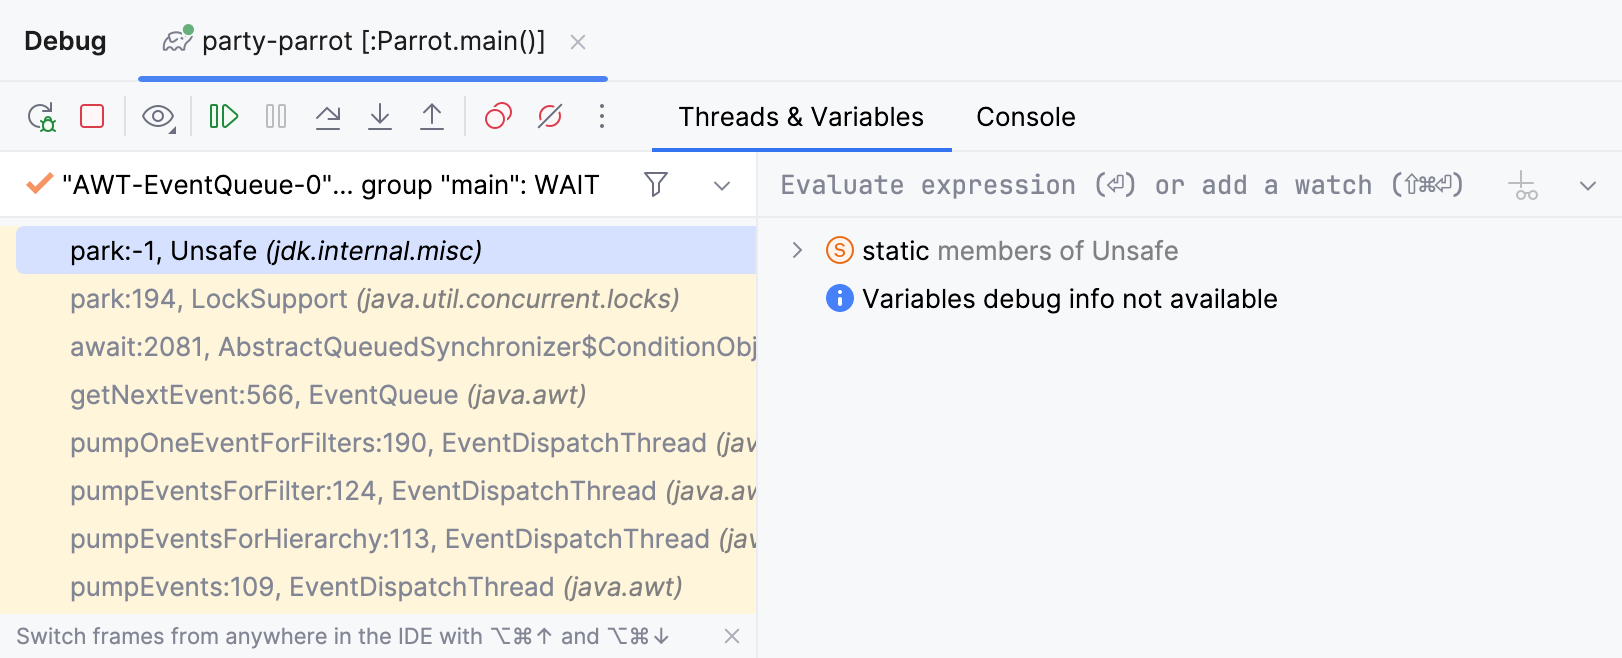
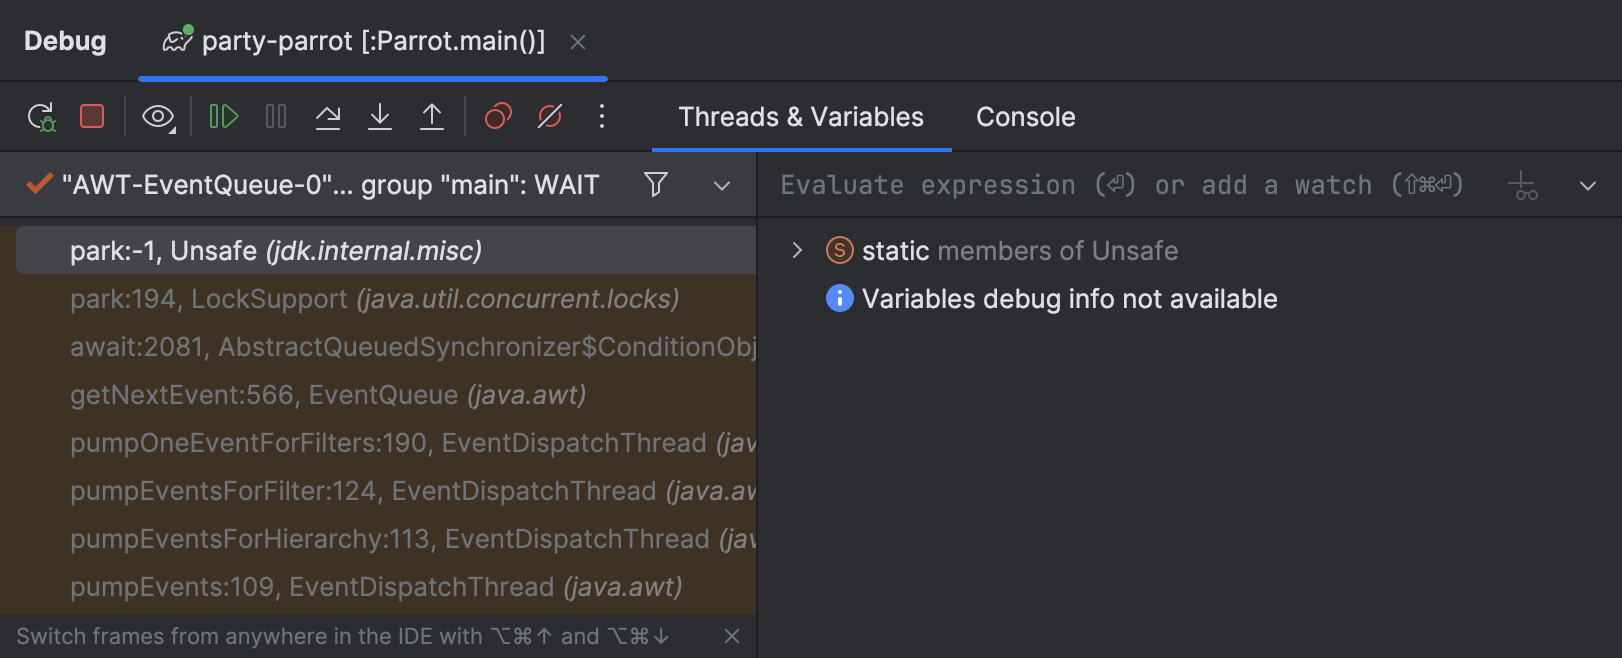
Unfortunately, this did not tell us much because all the threads involved in the parrot party are in the waiting state. Inspecting their stacks gives no indication why the freeze happened. Clearly, we need to try another approach.
Monitor resources’ usage
Since we are getting an OutOfMemoryError ,
a good starting point for analysis is CPU and Memory Live Charts.
They allow us to visualize real-time resources usage for the processes that are running.
Let’s open the charts
for our parrot app and see if we can spot anything when the animation freezes.
Indeed, we see that the memory usage is going up continually before reaching a plateau. This is precisely the moment when the animation hangs, and after that it seems to hang forever.
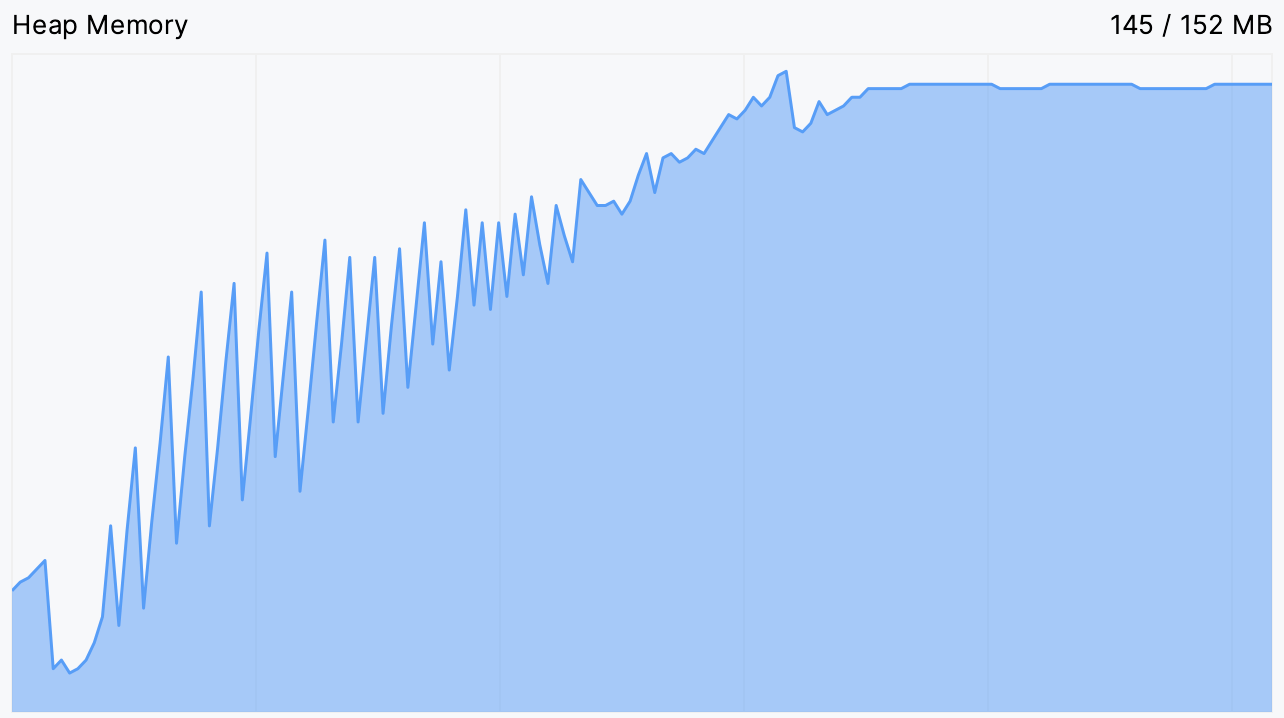
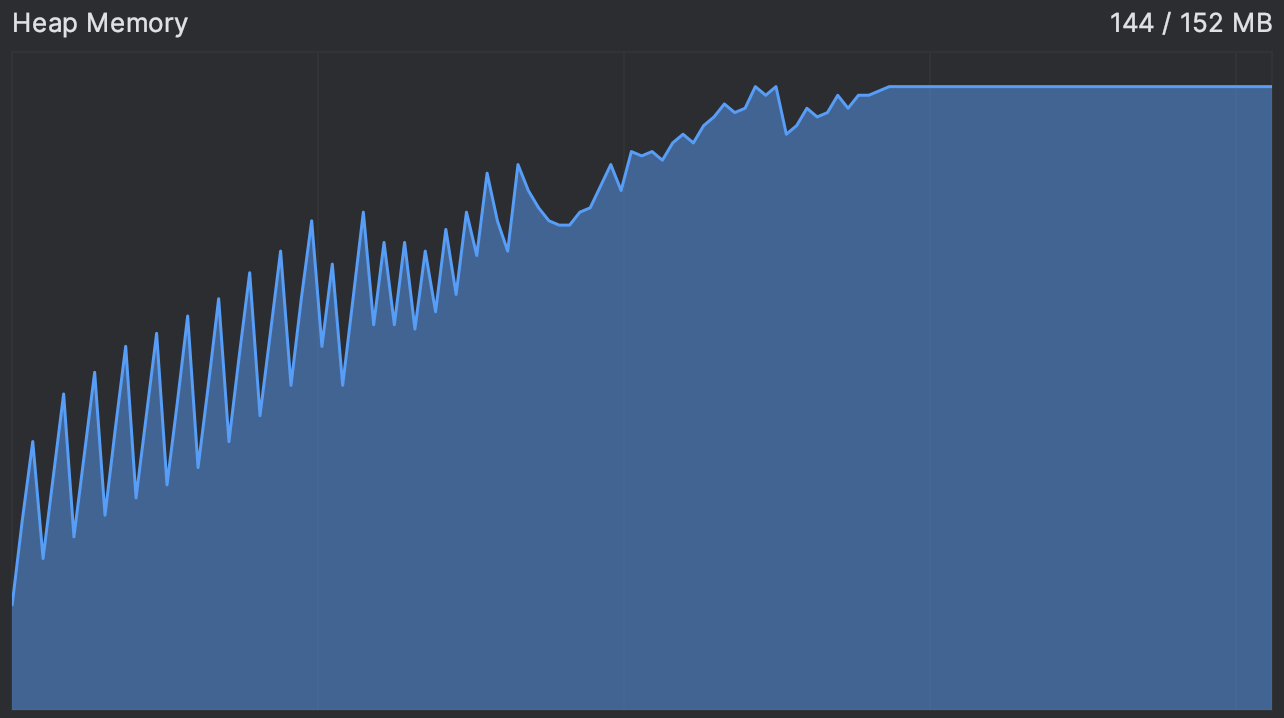
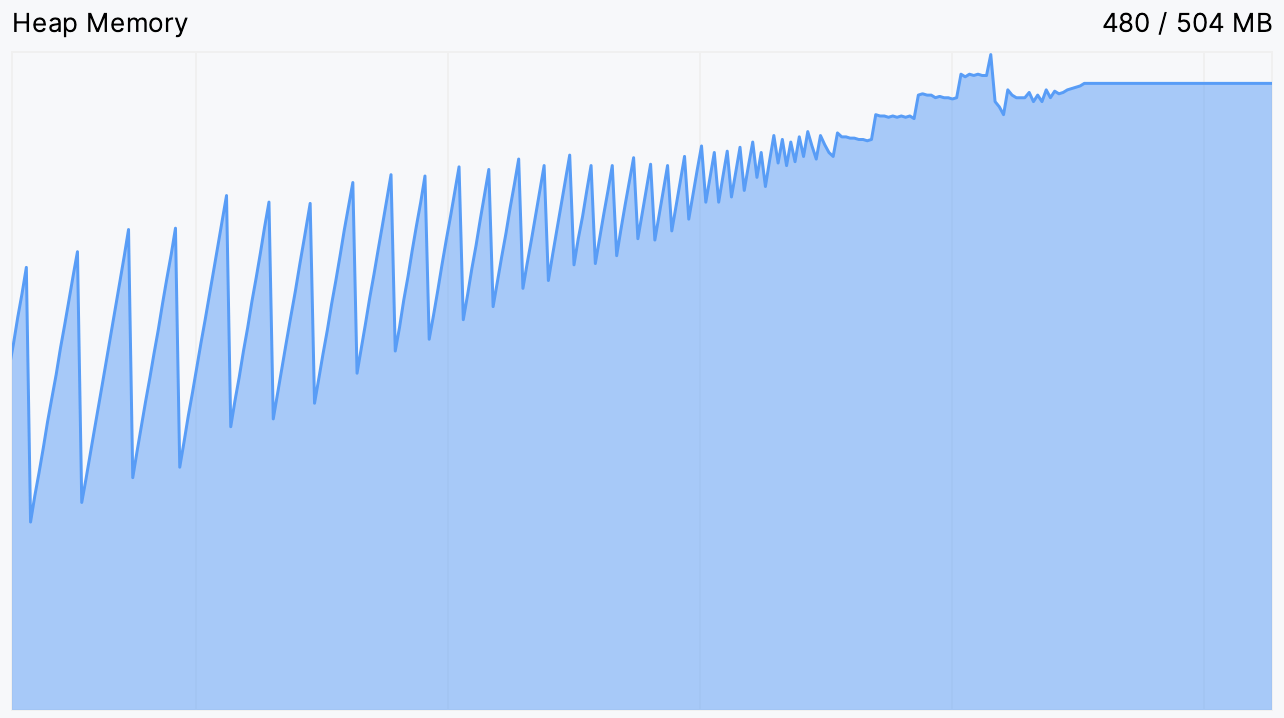
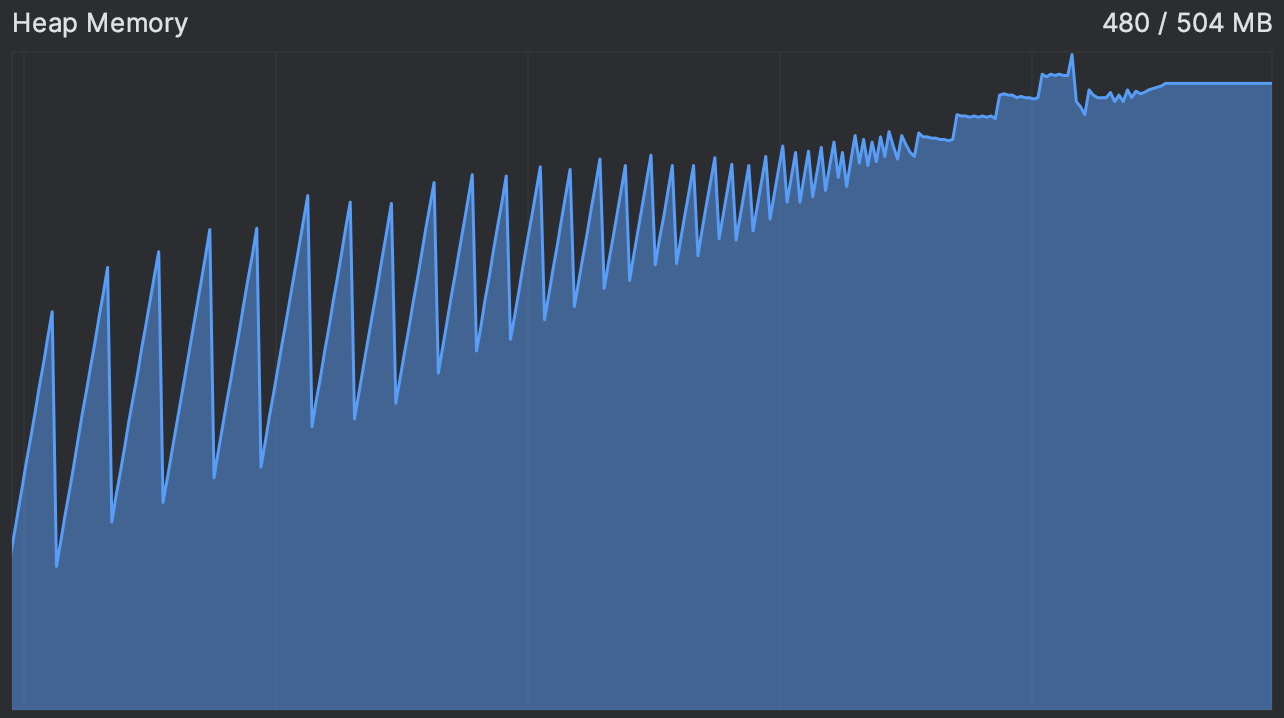
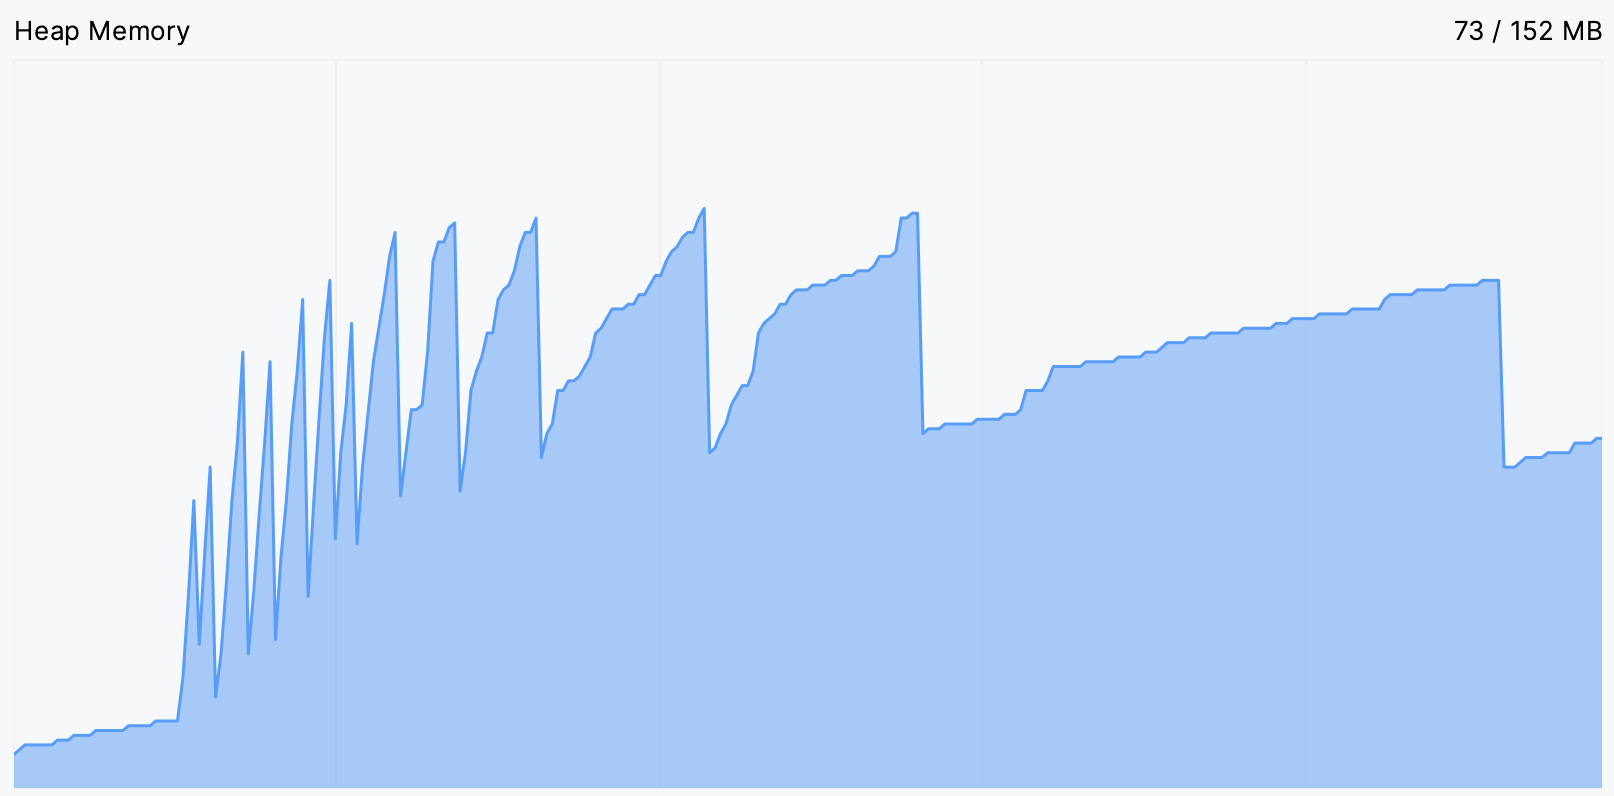
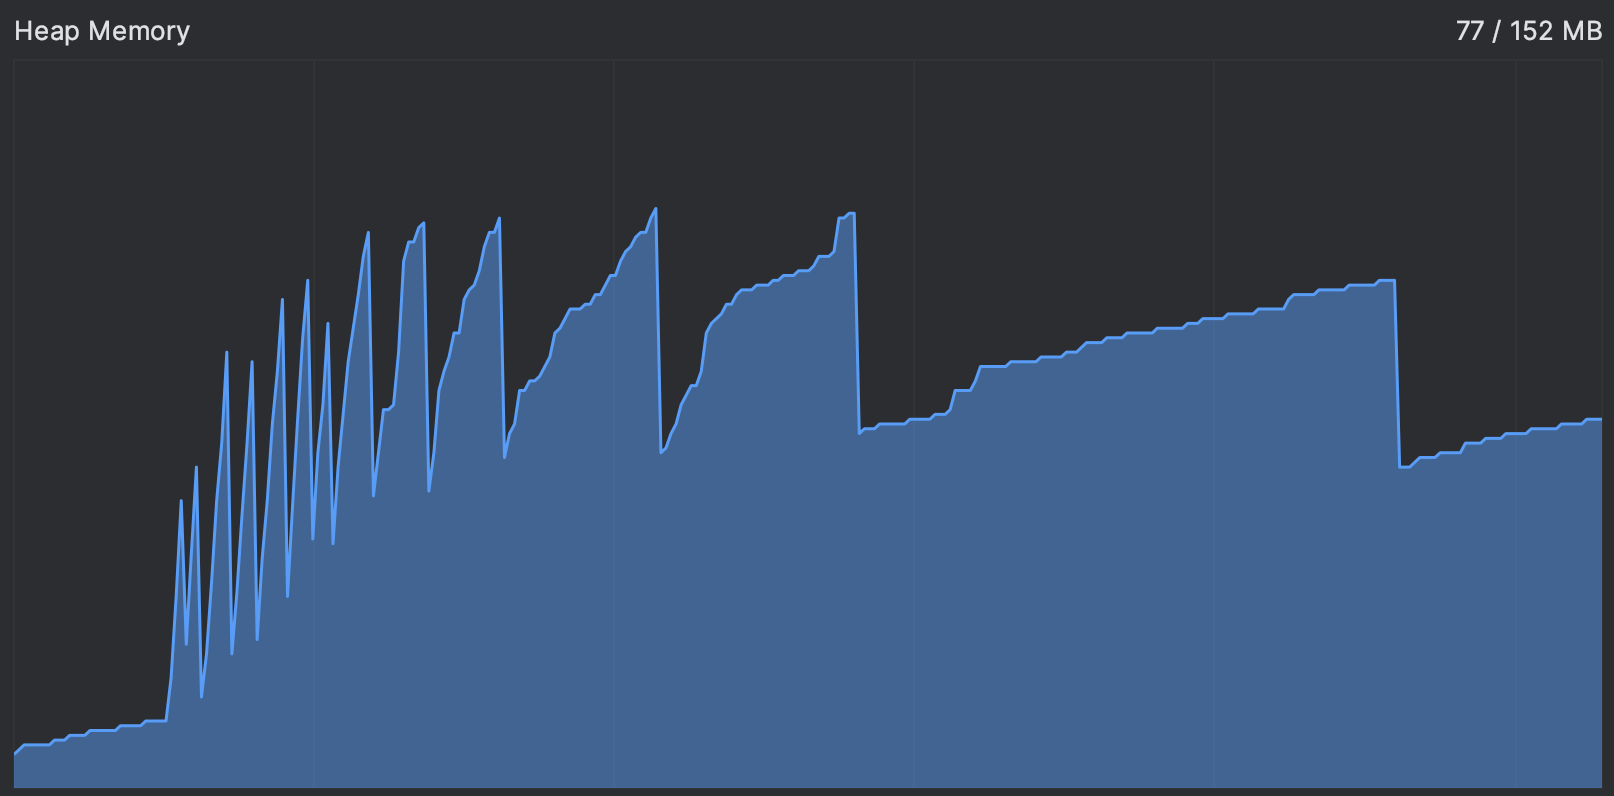
This gives us a clue. Usually, the memory usage curve is saw-shaped: the chart goes up when new objects are allocated and periodically goes down when the memory is reclaimed after garbage-collecting unused objects. You can see an example of a normally operating program in the picture below:
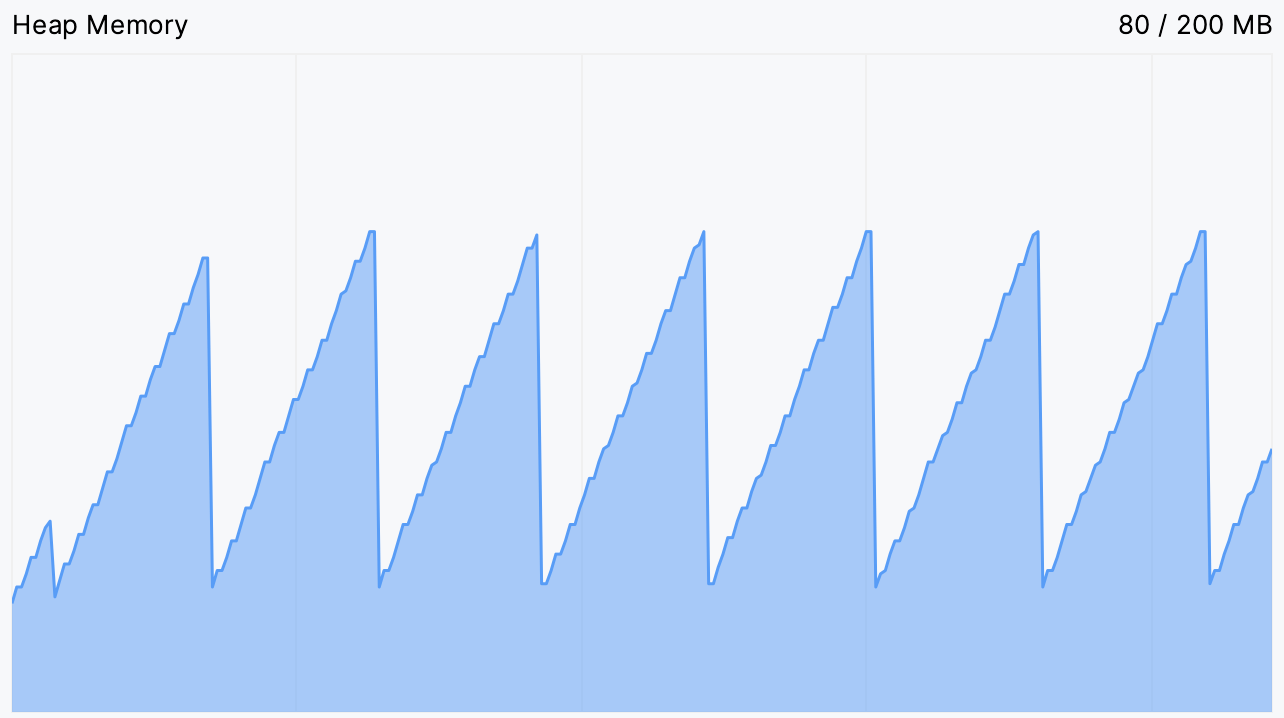
If the saw teeth become too frequent, it means that the garbage collector is working intensively to free up the memory. A plateau means it can’t free up any.
We can test if the JVM is able to perform a garbage collection by explicitly requesting one:
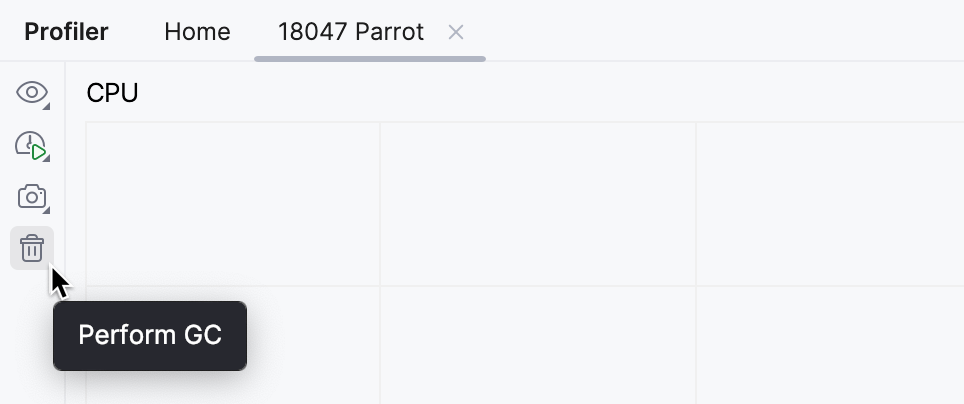
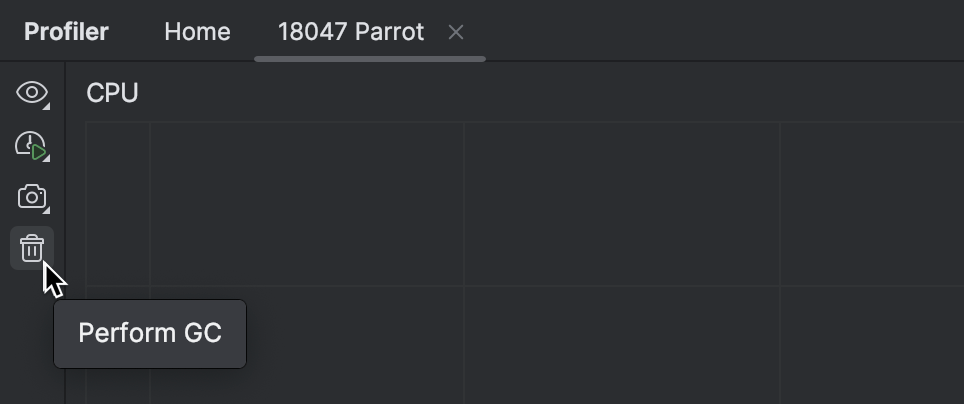
Memory usage does not go down after our app reaches the plateau, even if we manually prompt it to free up some memory. This supports our hypothesis that there are no objects eligible for garbage collection.
A naïve solution would be to just add more memory. For this, add the -Xmx500m
VM option to the run configuration.
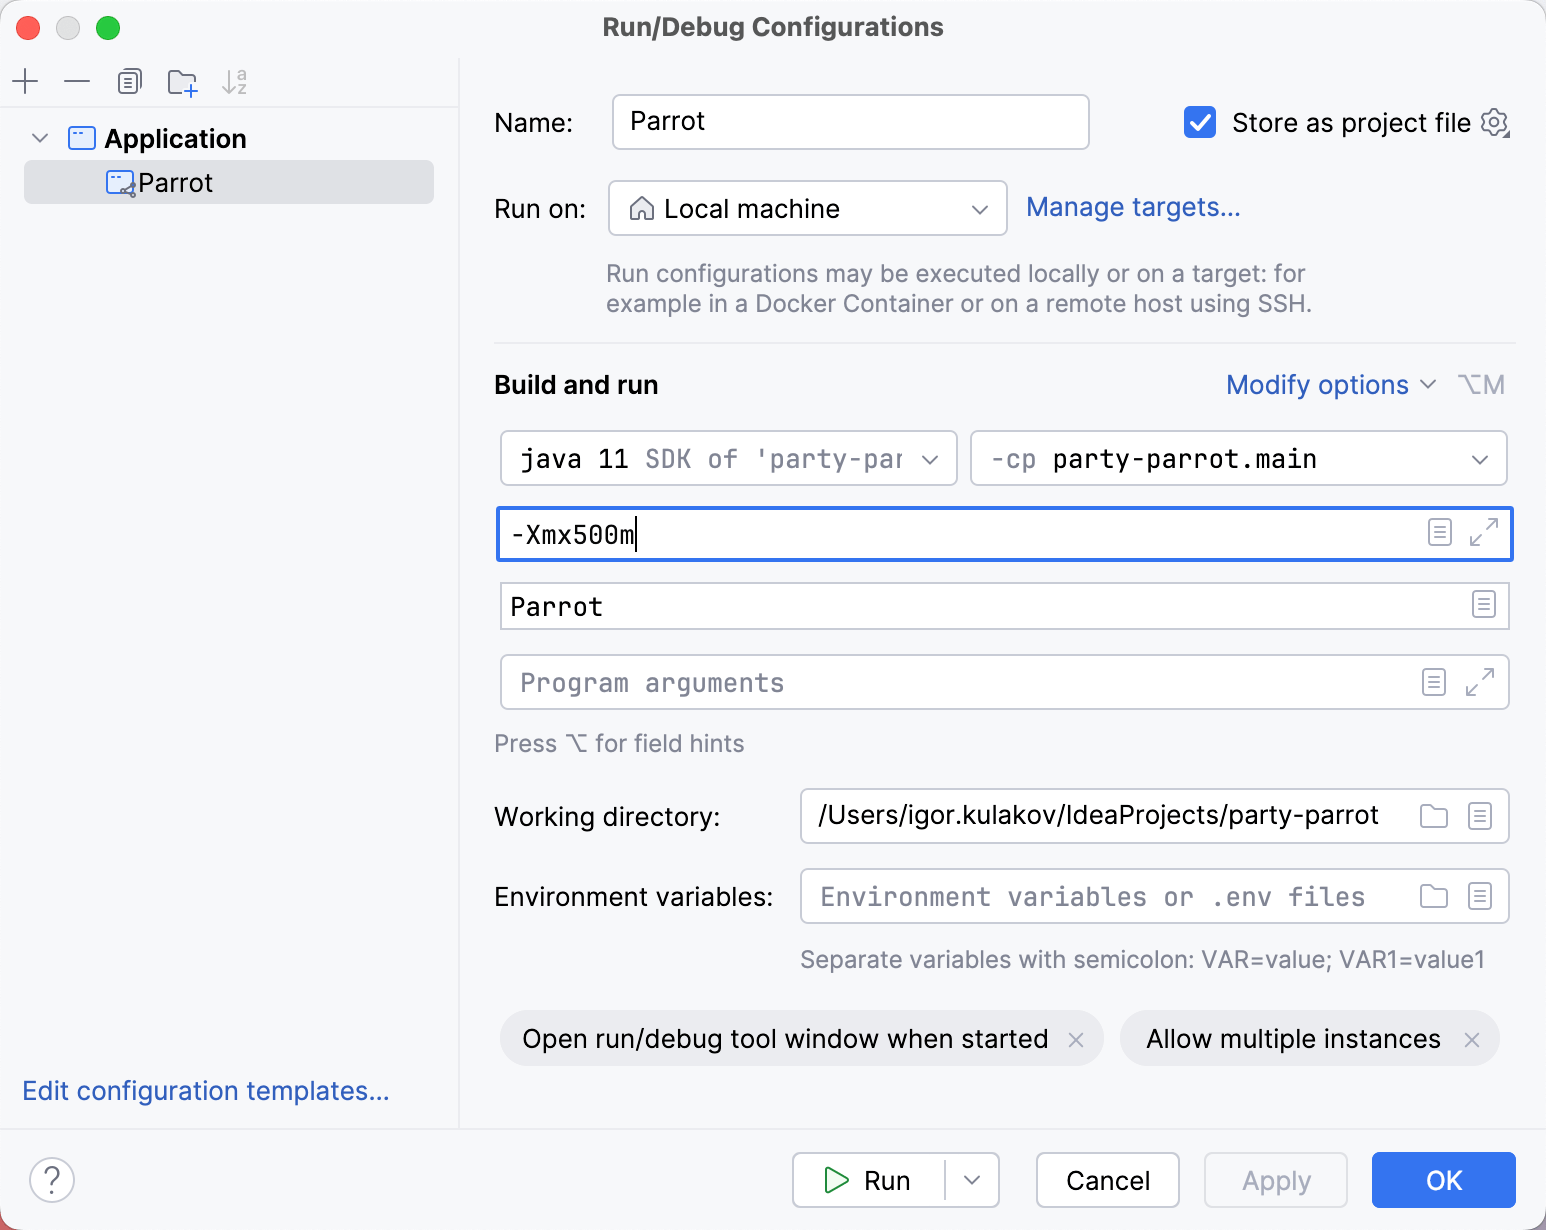
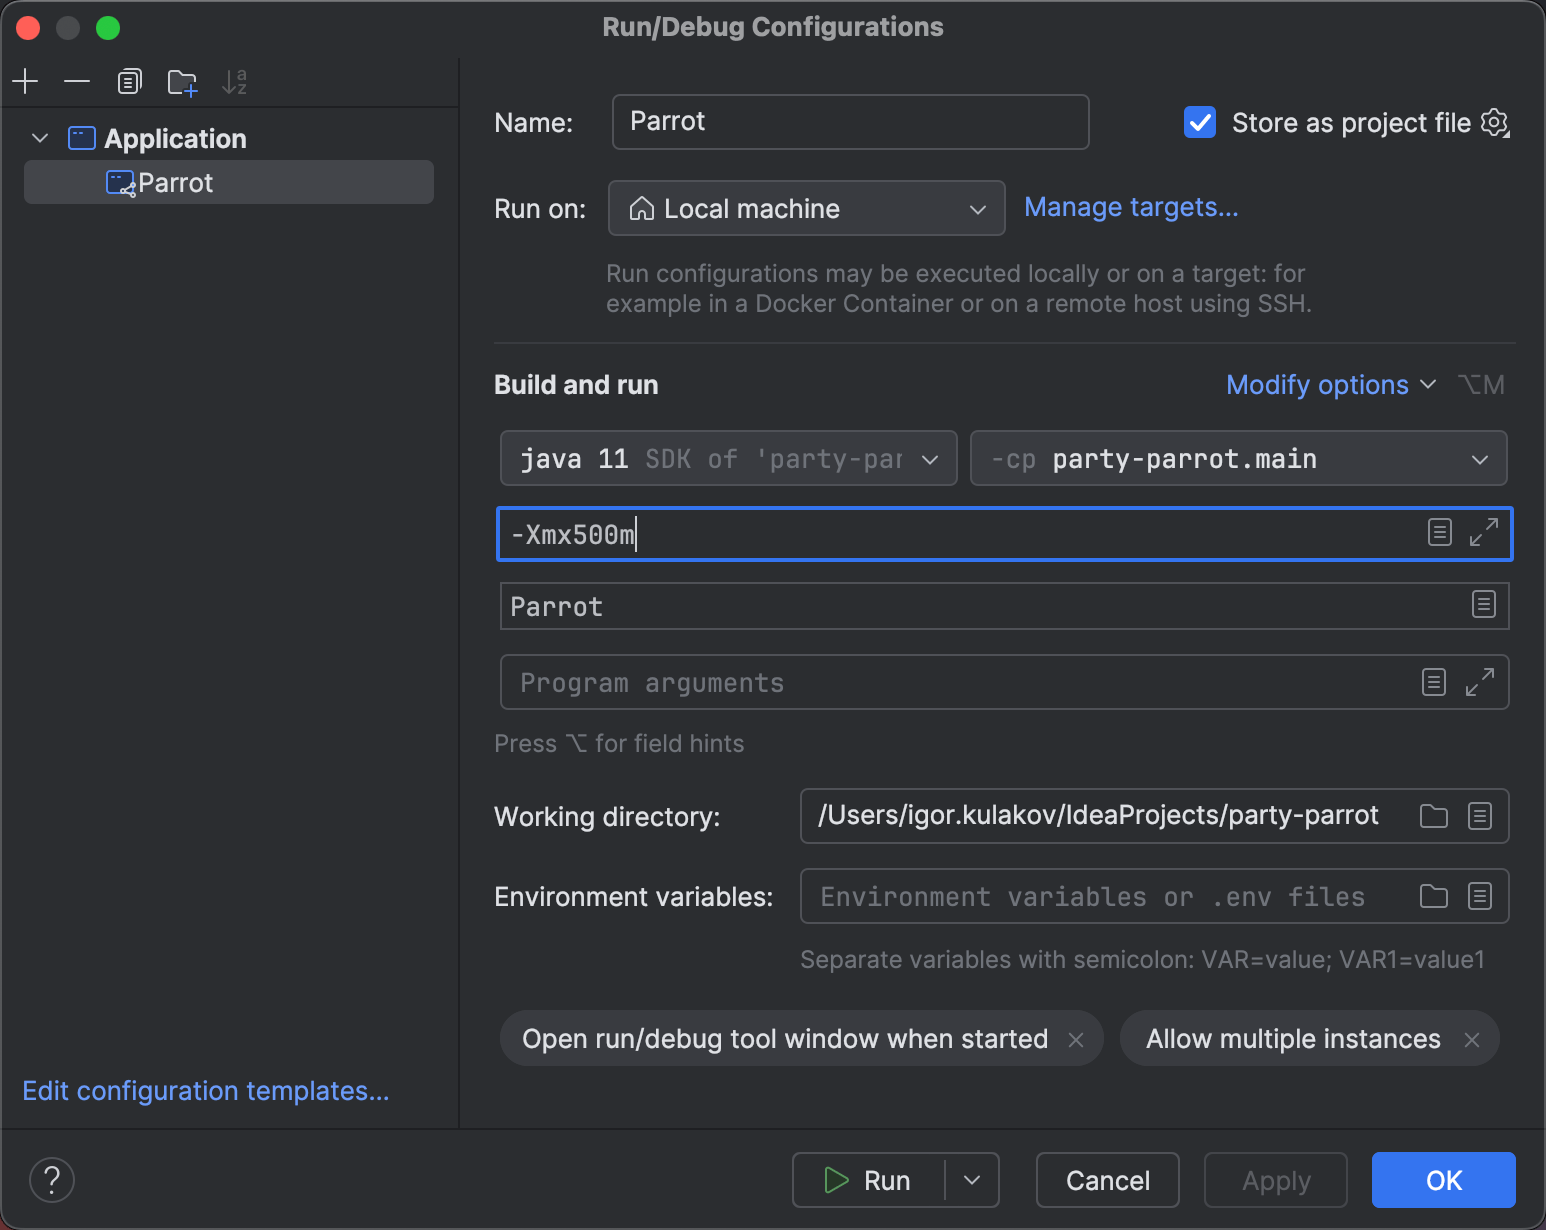

To quickly access the settings of the currently selected run configuration, hold ‘Shift’ and click the run configuration name on the main toolbar.
Regardless of the available memory, the parrot runs out of it anyway. Again, we see the same picture. The only visible effect of extra memory was that we delayed the end of the “party”.
Allocation profiling
Since we know our application never gets enough memory, it is reasonable to suspect a memory leak
and analyze its memory usage.
For this, we can collect a memory dump using the -XX:+HeapDumpOnOutOfMemoryError
VM option. This is a perfectly acceptable approach for inspecting the heap;
however, it will not point at the code responsible for creating these objects.
We can get this information from a profiler snapshot: not only will it provide statistics on the types of the objects, but it will also reveal the stack traces corresponding to when they were created. Although this is a little unconventional use case for allocation profiling, nothing prevents us from using it to identify the issue.
Let’s run the application with IntelliJ Profiler attached. While running, the profiler will periodically record the threads’ state and collect data about memory allocation events. This data is then aggregated in a human-readable form to give us an idea of what the application was doing when allocating these objects.
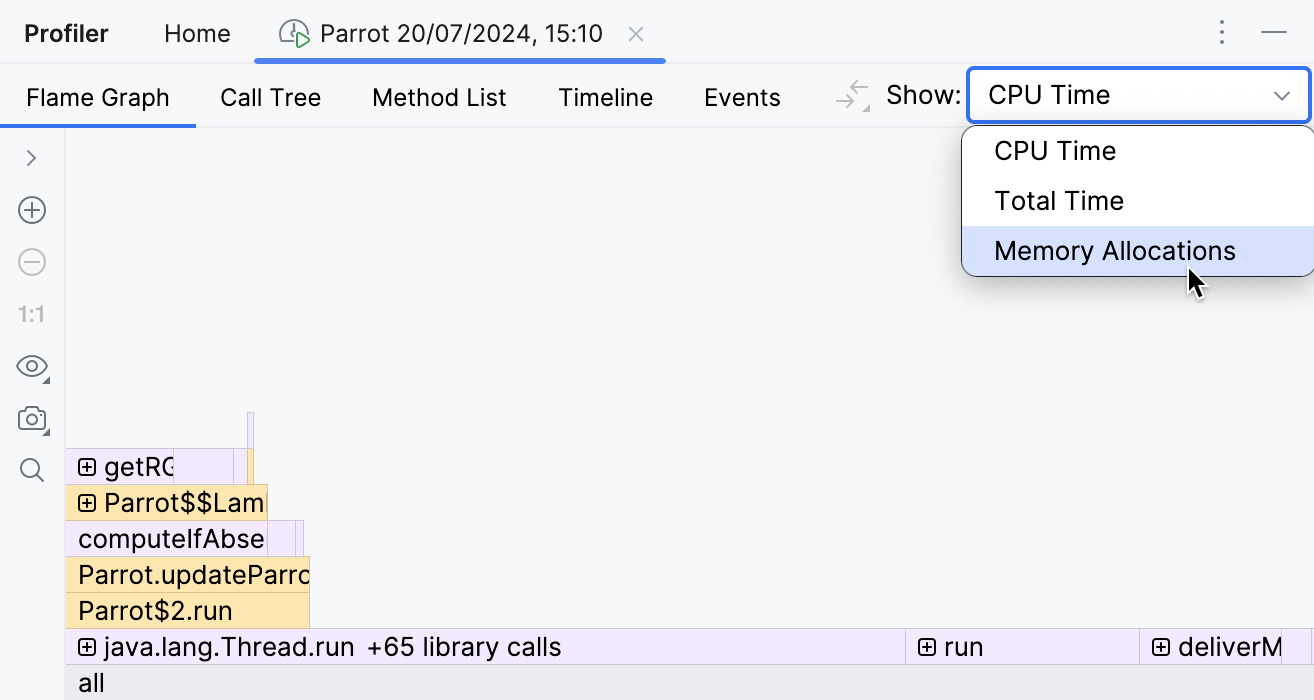
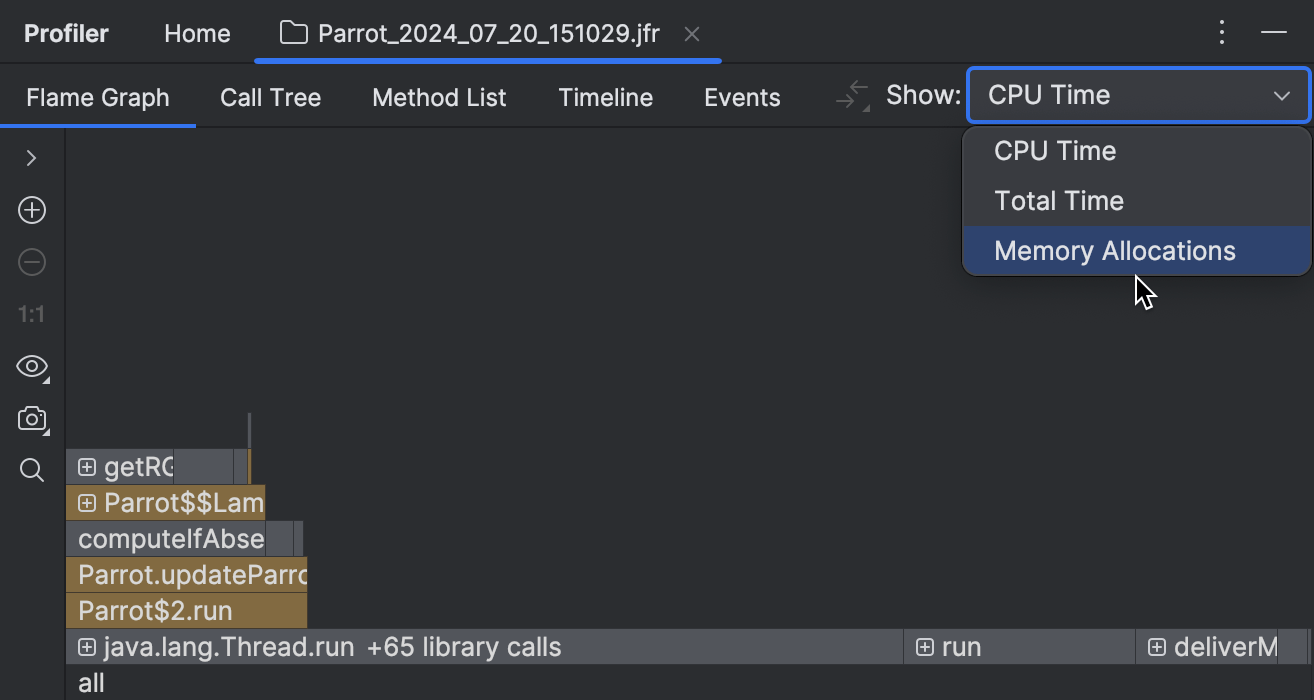
After running the profiler for some time, let’s open the report and select Memory Allocations:
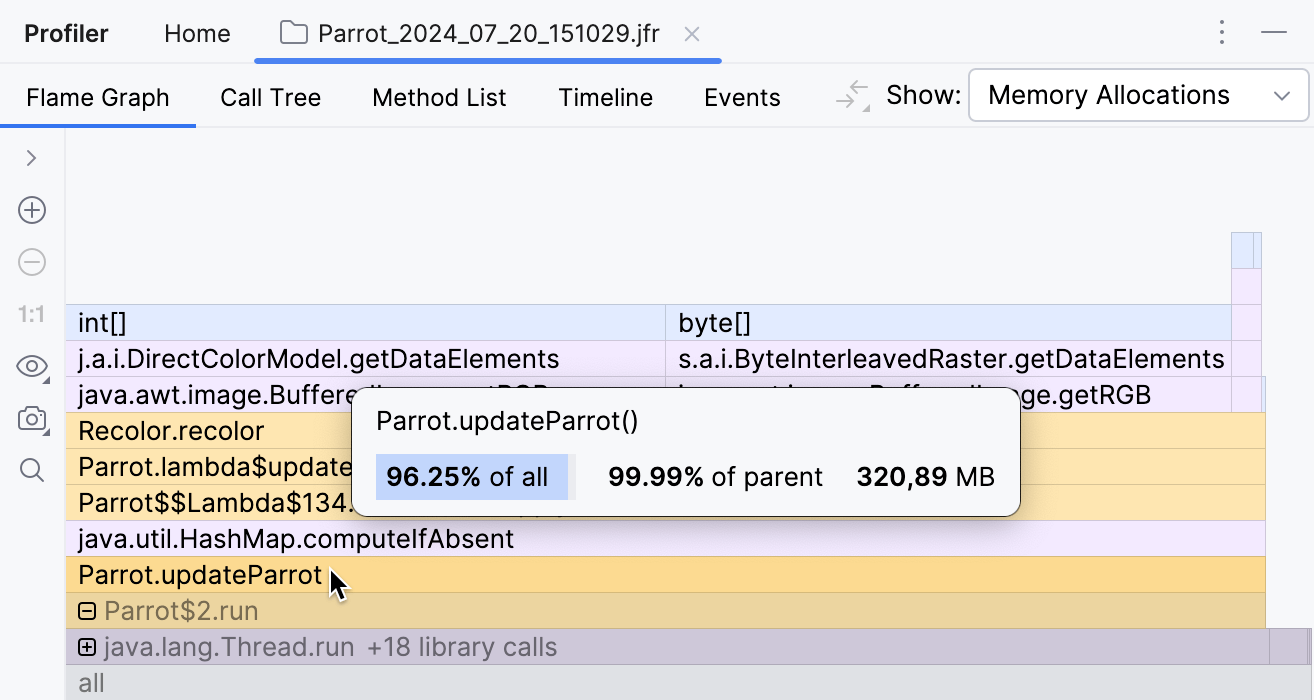
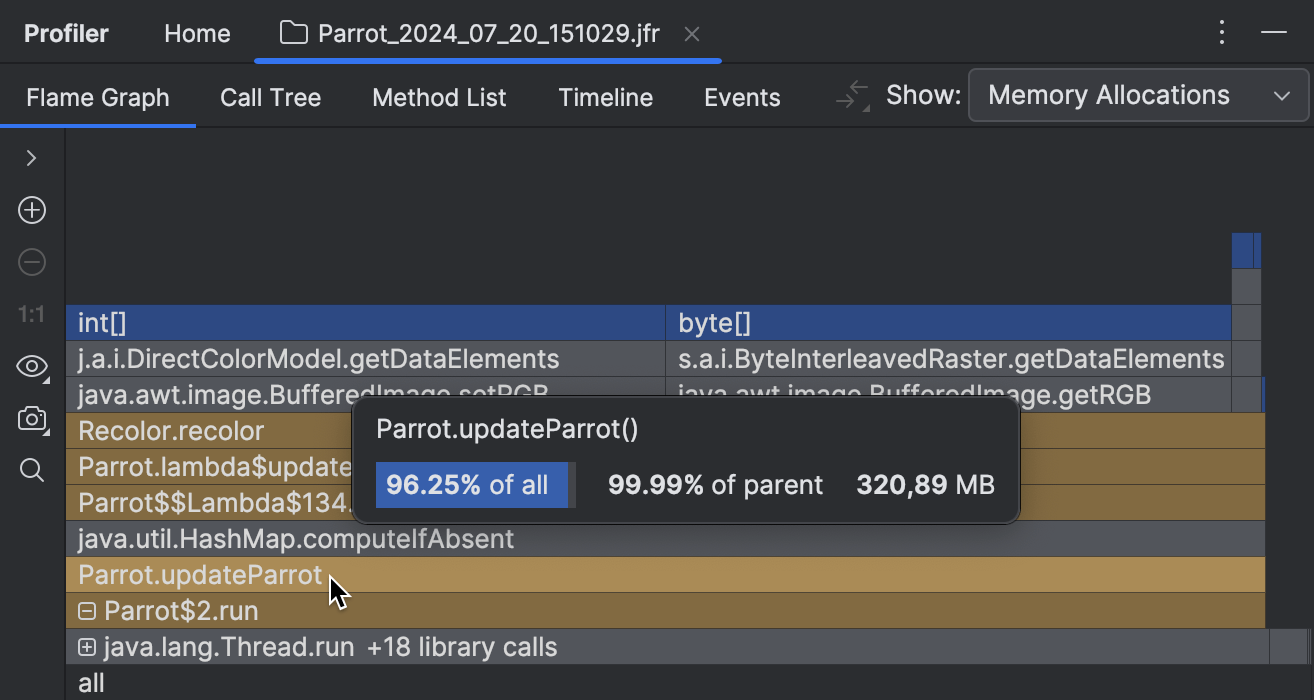
There are several views available for the collected data. In this tutorial, we will use the flame graph. It aggregates the collected stacks in a single stack-like structure, adjusting the element width according to the number of collected samples. The widest elements represent the most massively allocated types during the profiling period.
An important thing to note here is that a lot of allocations don’t necessarily indicate a problem. A memory leak happens only if the allocated objects are not garbage-collected. While allocation profiling doesn’t tell us anything about the garbage collection, it can still give us hints for further investigation.
![The two largest frames in the allocation graph are int[] and byte[]](/img/profile-memory-allocations/flame-graph-1.png)
![The two largest frames in the allocation graph are int[] and byte[]](/img/profile-memory-allocations/flame-graph-1-dark.png)
Let’s see where the two most massive elements,
byte[] and int[] are coming from.
The top of the stack tells us that these arrays are created during image processing by the code from the
java.awt.image package.
The bottom of the stack tells us that all this happens in a separate thread managed by an executor service.
We aren’t looking for bugs in library code, so let’s look at the project code that’s in between.
Going from top to bottom, the first application method we see is
recolor() , which in turn is called by
updateParrot() .
Judging by the name, this method is exactly what makes our parrot move.
Let’s see how this is implemented and why it needs that many arrays.
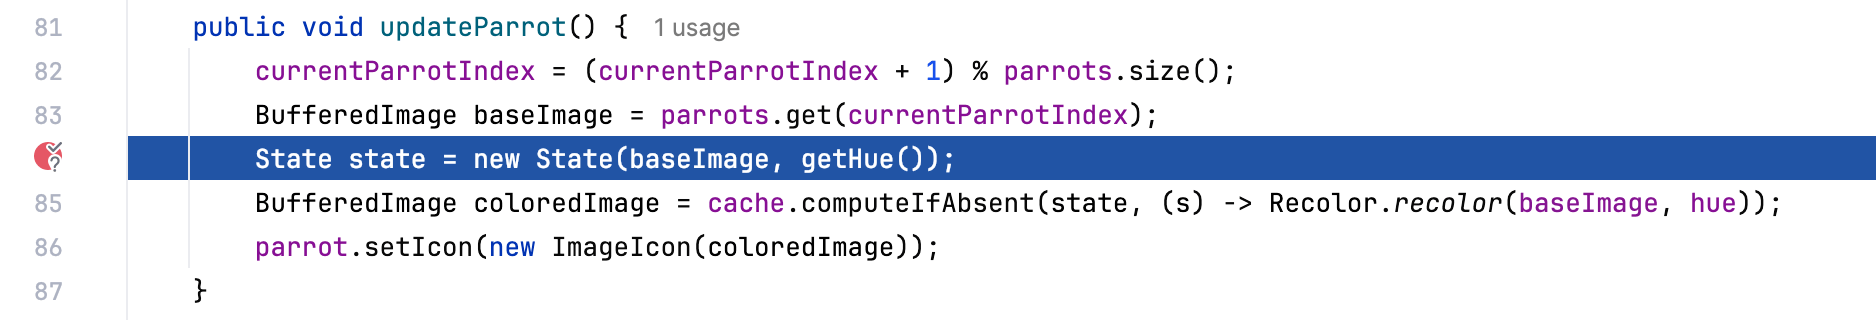
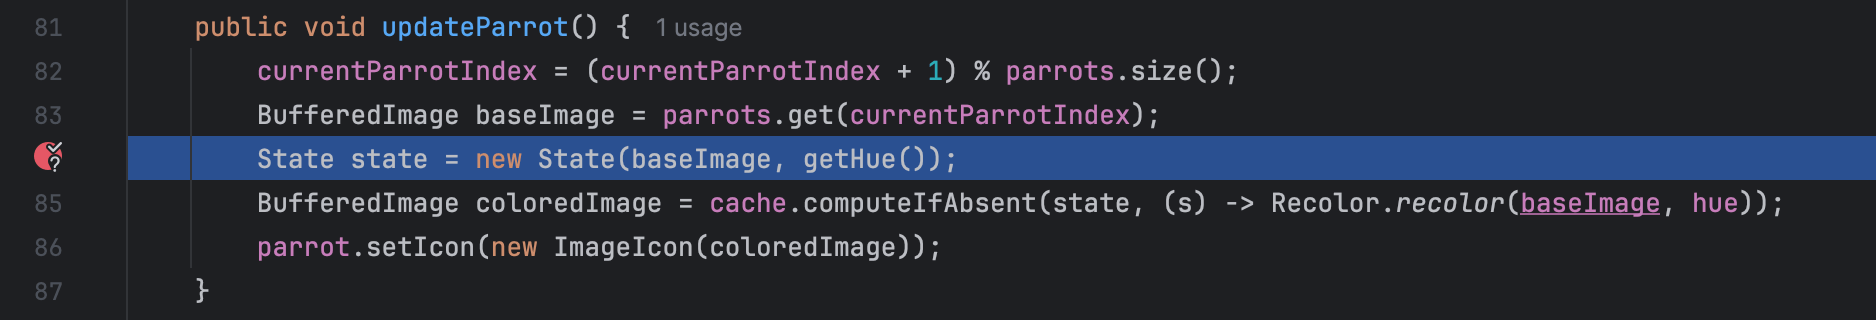
Clicking at the frame takes us to the source code of the corresponding method:
public void updateParrot() {
    currentParrotIndex = (currentParrotIndex + 1) % parrots.size();
    BufferedImage baseImage = parrots.get(currentParrotIndex);
    State state = new State(baseImage, getHue());
    BufferedImage coloredImage = cache.computeIfAbsent(state, (s) -> Recolor.recolor(baseImage, hue));
    parrot.setIcon(new ImageIcon(coloredImage));
}
It seems that updateParrot() takes some base image and then recolors it.
In order to avoid extra work, the implementation first tries to retrieve the image from some cache.
The key for retrieval is a State object, whose constructor
takes a base image and a hue:
public State(BufferedImage baseImage, int hue) {
    this.baseImage = baseImage;
    this.hue = hue;
}
Analyze data flow
Using the built-in static analyzer, we can trace the range of input values for the
State constructor call.
Right-click the baseImage constructor argument,
then from the menu, select Analyze | Data Flow to Here.
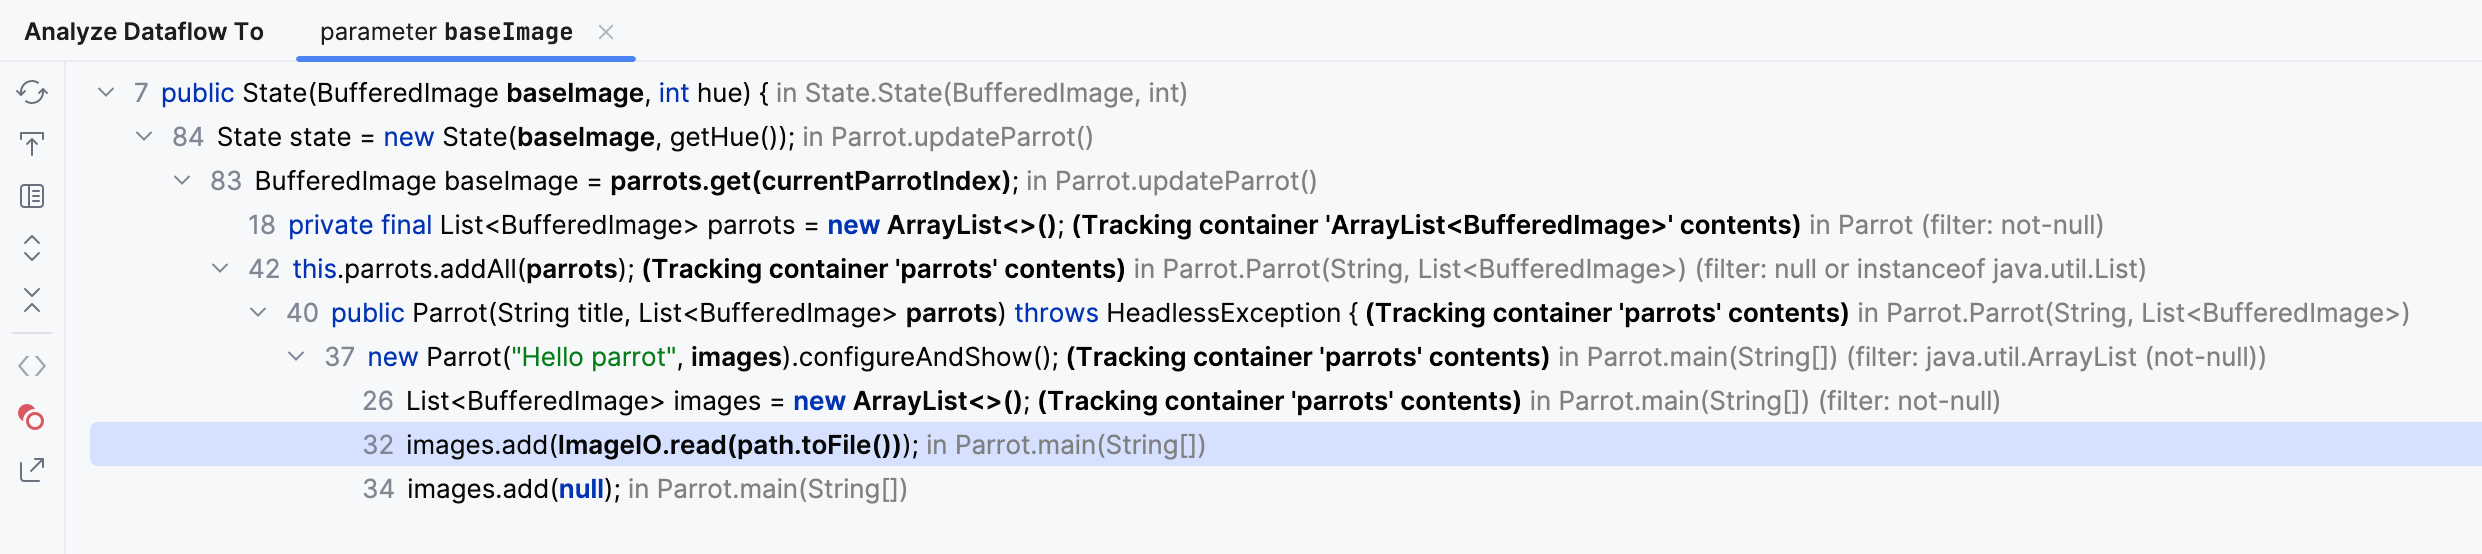
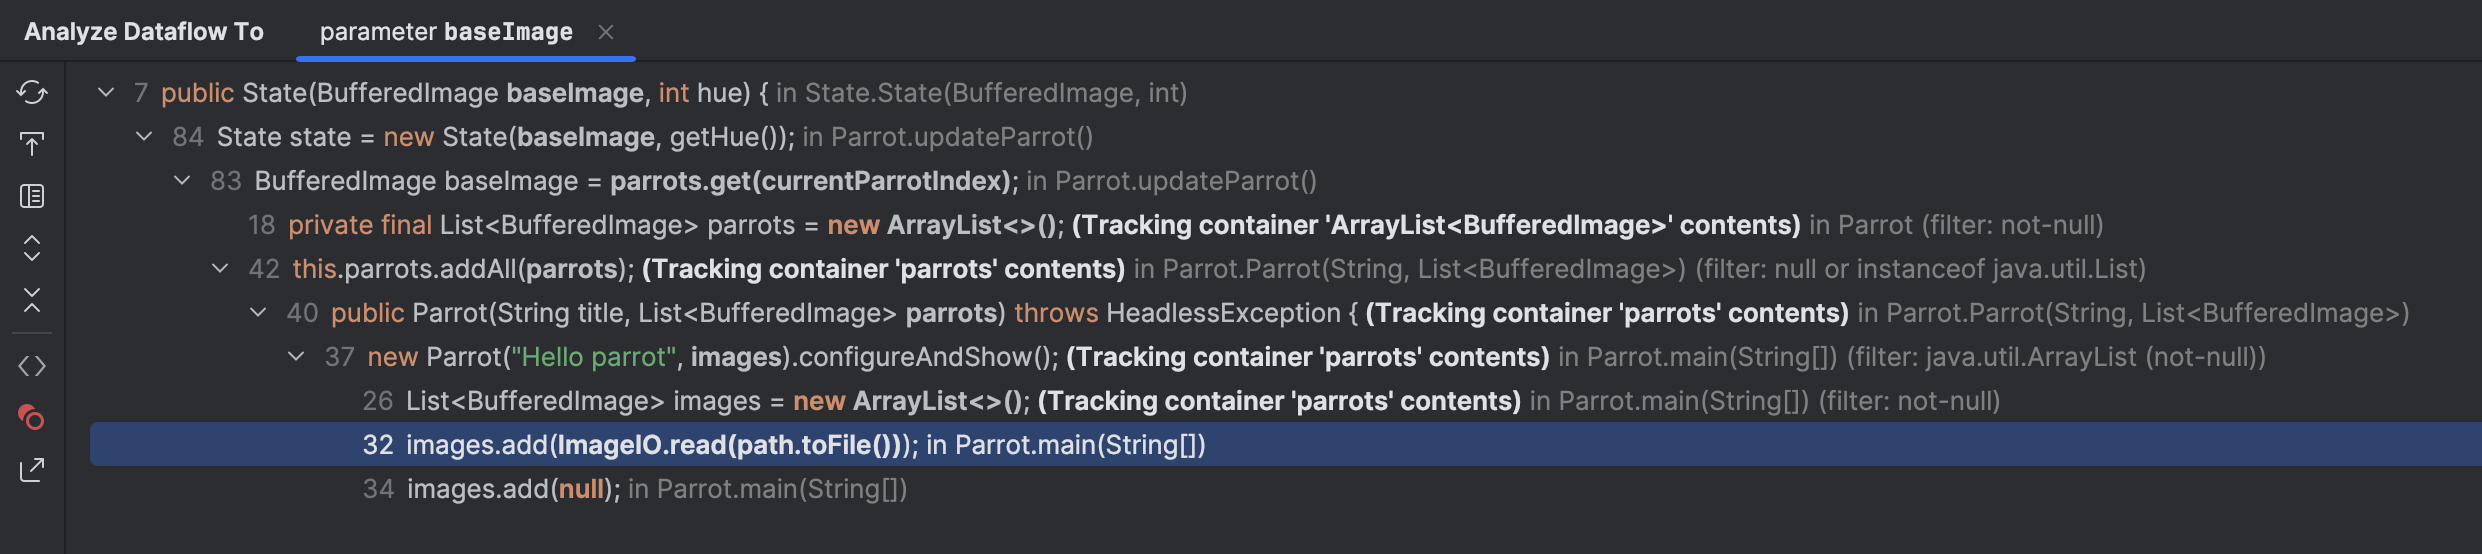
Expand the nodes and pay attention to ImageIO.read(path.toFile()) .
It shows us that the base images come from a set of files.
If we double-click this line and look at the PARROTS_PATH constant that is nearby,
we discover the files’ location:
public static final String PARROTS_PATH = "src/main/resources";By navigating to this directory, we can see the following:
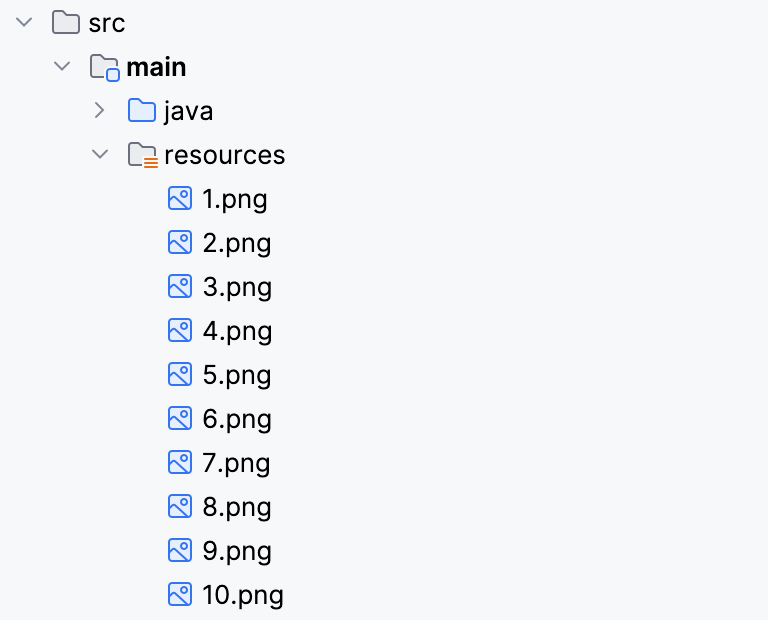
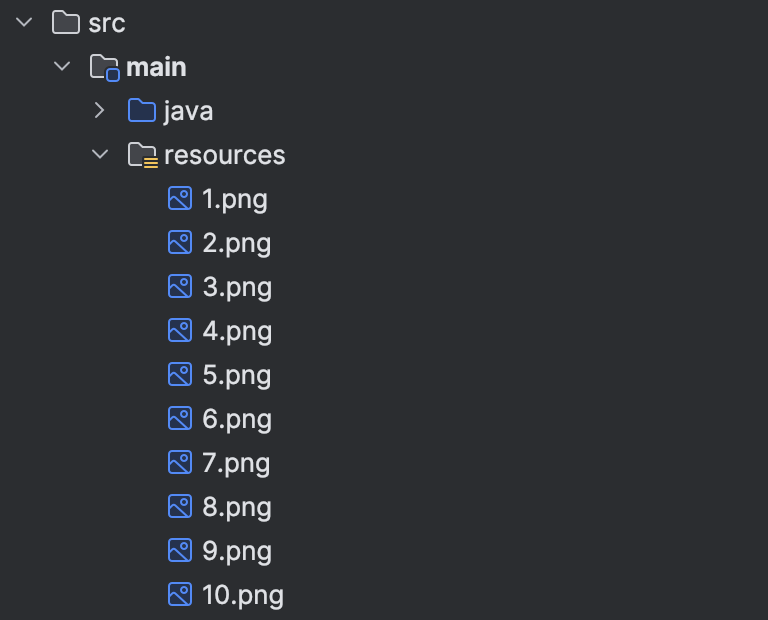
That’s ten base images that correspond to the possible positions of the parrot.
Well, what about the hue constructor argument?
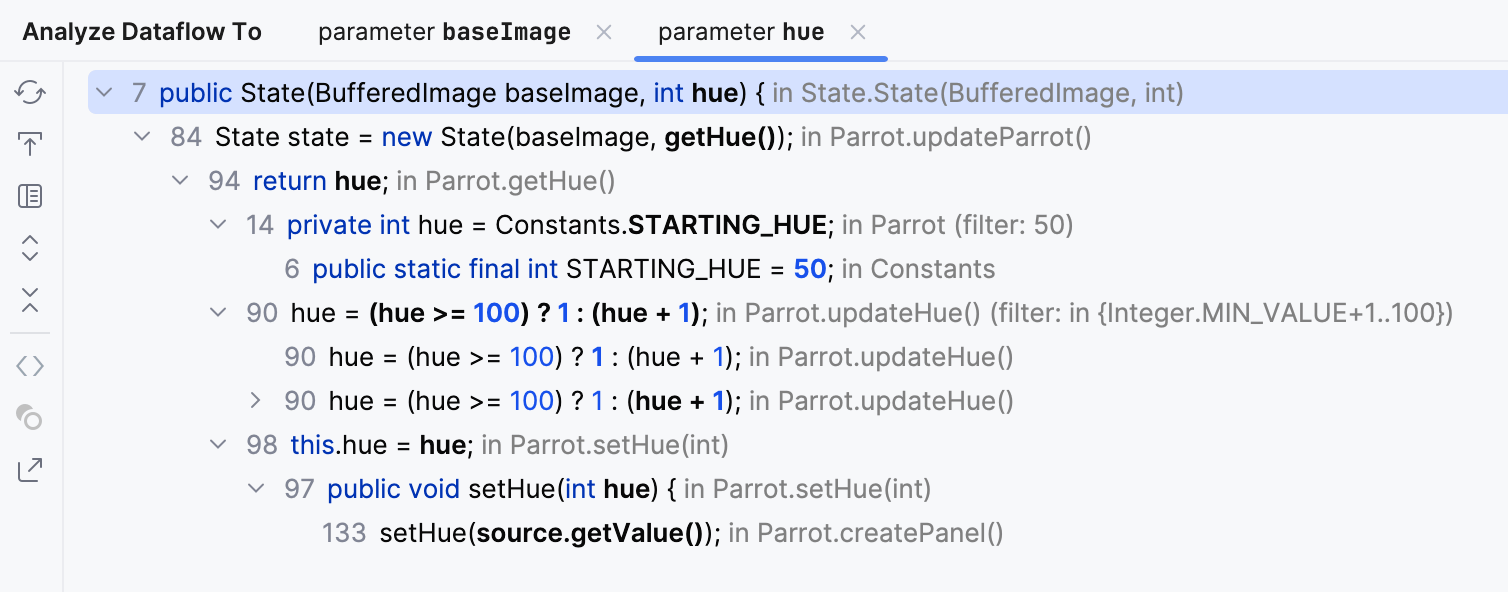
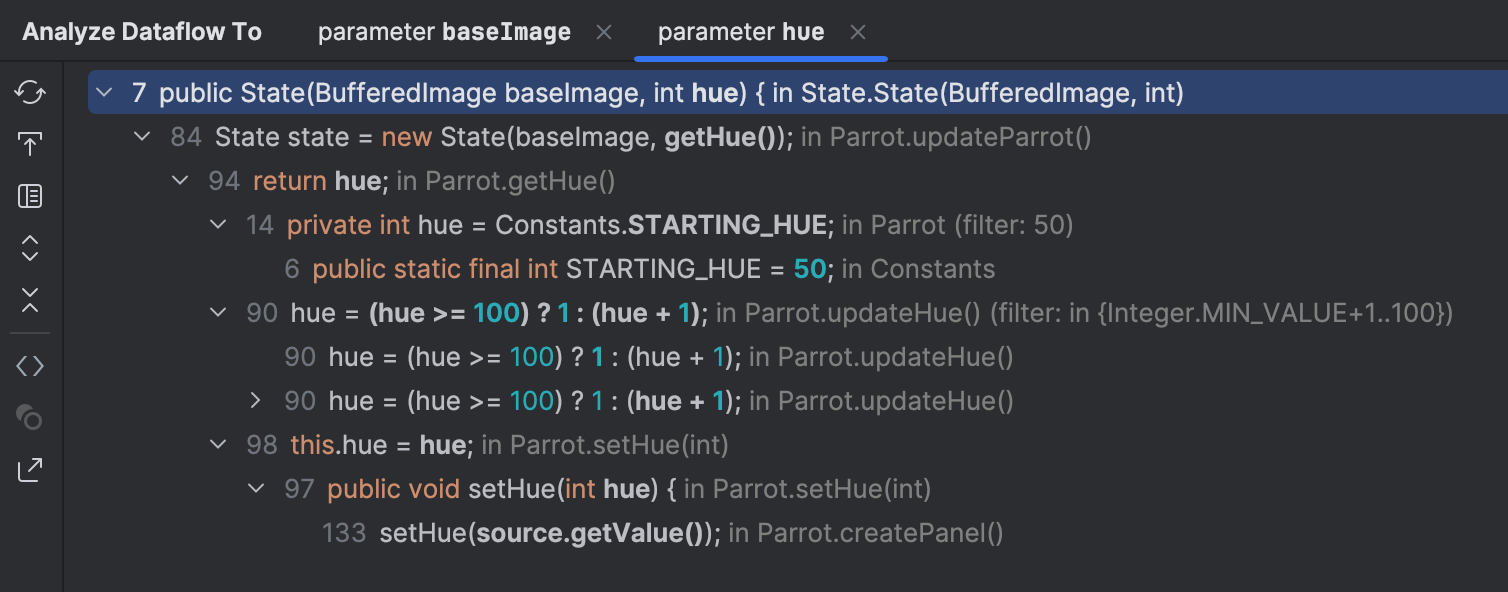
If we inspect the code that modifies the hue variable, we see that it has
a starting value of 50 .
Then it is either set with a slider or updated automatically from the
updateHue() method.
Either way, it is always within the range of 1 to 100 .
So, we have 100 variants of hue and 10 base images, which should guarantee that the cache never grows bigger than 1000 elements. Let’s check if that holds true.
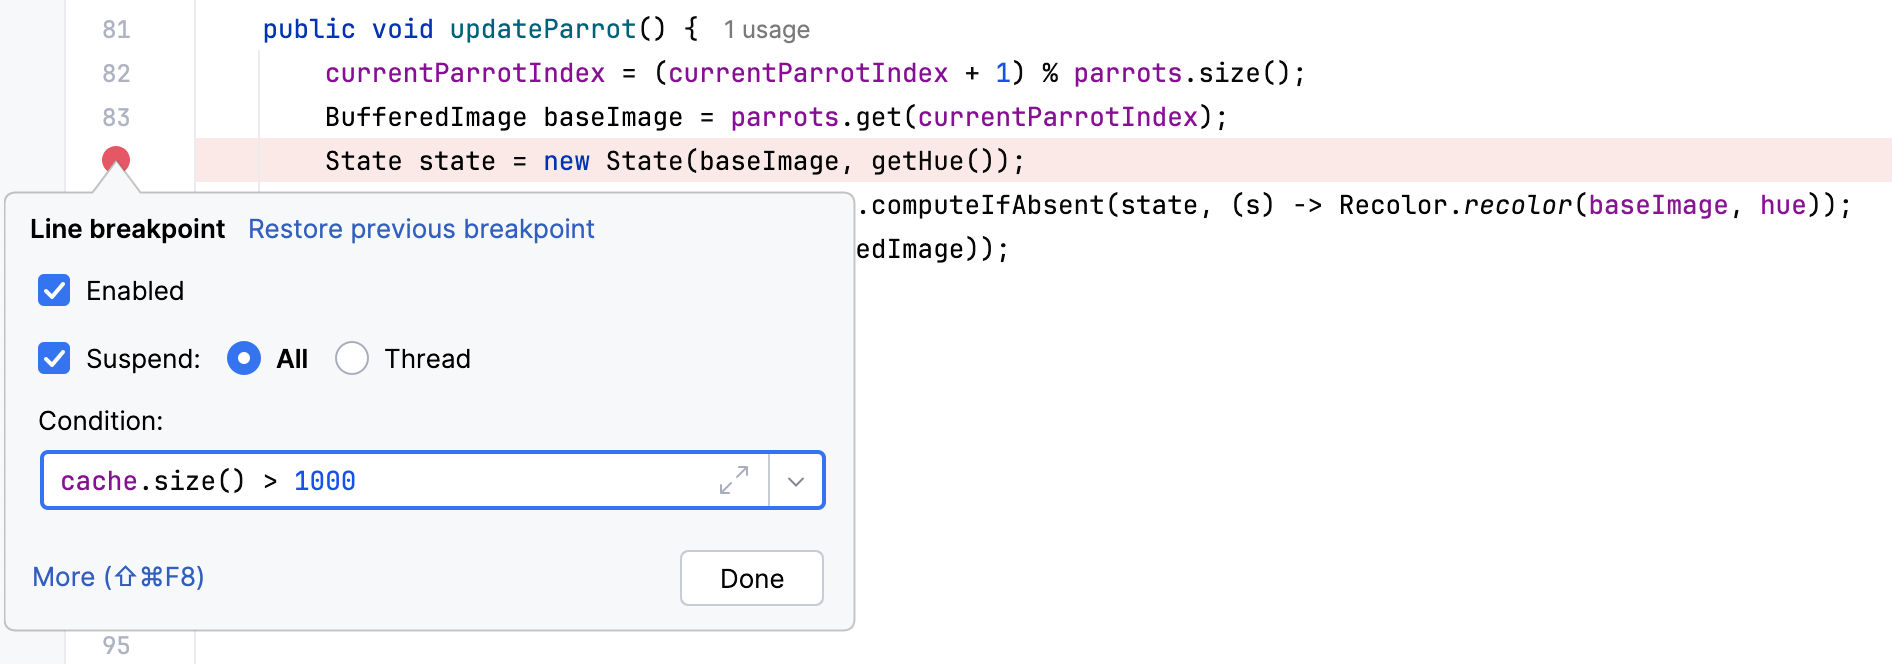
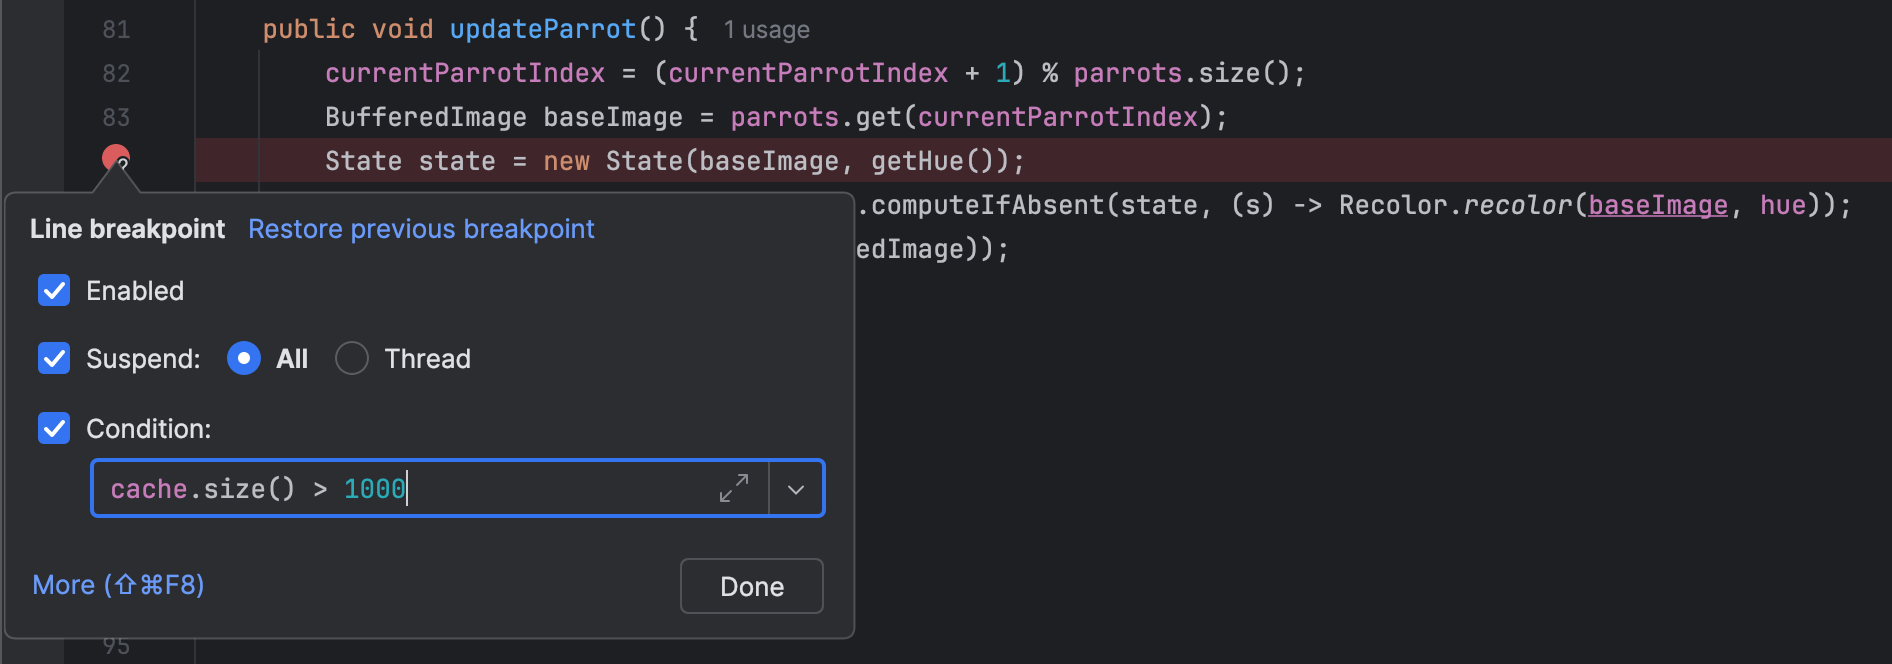
Conditional breakpoints
Now, this is where the debugger can be useful. We can check the size of the cache with a conditional breakpoint.
Setting a conditional breakpoint in hot code might significantly slow down the target application.
Let’s set a breakpoint at the update action and add a condition so that it only suspends the application when the cache size exceeds 1000 elements.
Now run the app in debug mode.
Indeed, we stop at this breakpoint after running the program for some time, which means the problem is indeed in the cache.
Inspect the code
Cmd + B
on cache takes us to its declaration site:
private static final Map<State, BufferedImage> cache = new HashMap<>();If we check the documentation for HashMap ,
we’ll find that its implementation relies on the equals()
and hashcode() methods,
and the type that is used as the key has to correctly override them.
Let’s check it. Cmd + B
on State takes us to the class definition.
class State {
    private final BufferedImage baseImage;
    private final int hue;

    public State(BufferedImage baseImage, int hue) {
        this.baseImage = baseImage;
        this.hue = hue;
    }

    public BufferedImage getBaseImage() { return baseImage; }

    public int getHue() { return hue; }
}
Seems like we have found the culprit: the implementation of equals()
and hashcode() isn’t just incorrect. It’s completely missing!
Override methods
Writing implementations for equals()
and hashcode() is a mundane task.
Luckily, modern tools can generate them for us.
While in the State class,
press Cmd + N
and select equals() and hashcode().
Accept the suggestions and click Next until the methods appear at the caret.
@Override
public boolean equals(Object o) {
    if (this == o) return true;
    if (o == null || getClass() != o.getClass()) return false;
    State state = (State) o;
    return hue == state.hue && Objects.equals(baseImage, state.baseImage);
}

@Override
public int hashCode() {
    return Objects.hash(baseImage, hue);
}
Check the fix
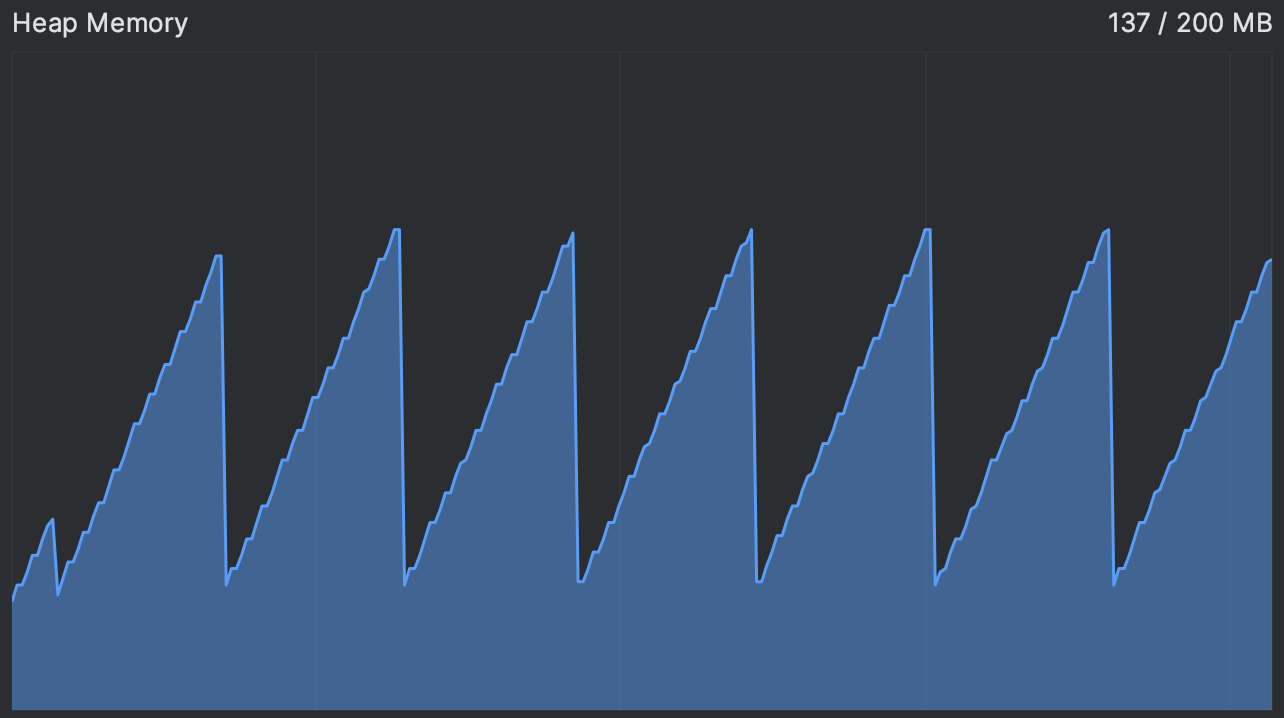
Let’s restart the application and see if things have improved. Again, we can use CPU and Memory Live Charts for that:
That is much better!
Summary
In this post, we looked at how we can start with the general symptoms of a problem and then, using our reasoning and the variety of tools available to us, narrow the scope of the search step-by-step until we find the exact line of code that’s causing the problem. More importantly, we made sure that the parrot party will go on no matter what!
As always, I will be happy to hear your feedback! Happy profiling!