Cobbling Together God Mode with the Debugger
Other languages: Español Français Deutsch 日本語 한국어 Português 中文
Back in the day, computer games were different. Not only have their graphics and mechanics evolved, but they also had one characteristic that doesn’t seem very common in games today: cheat codes.
Cheat codes were sequences of keys that would give you something extraordinary, such as infinite ammo or the ability to walk through walls. The most common and powerful of them was “god mode”, which made you invincible.

This is what your character would look like in Doom
when you punched in IDDQD
– the key combination for god mode.
In fact, this particular key sequence was so popular that it
became a meme and gained popularity beyond the game itself.
While god mode is not as prevalent in games as it once was, and the era of the IDDQD meme seems to be fading, one might wonder if a contemporary equivalent exists. Personally, I have my own modern take on IDDQD – the debugger. Though it’s not necessarily related to games, it does evoke the same sense of having superpowers.
Space Invaders
Here’s a fun little scenario to illustrate my point. Even if you aren’t familiar with Doom, you’ve probably seen this even older game called Space Invaders. Like Doom, its plot centers around the theme of fighting invaders in space.
My friend and colleague Eugene Nizienko has written an IntelliJ IDEA plugin that lets you play this game right in the editor – a great way to spend some time while waiting for indexing to finish.
There’s no god mode in this game, but if we are very determined, can we add it ourselves? Let’s bring back the classic tradition of hacking programs with a debugger to find out!

Be responsible! I got Eugene’s consent before tampering with his program. If you’re using the debugger on code that is not yours, make sure to do so ethically. Otherwise, just don’t do it.
Get the tools ready
Prepare for a meta experience – we’re going to debug IntelliJ IDEA using its own debugger.
But there’s a little problem: when debugging IntelliJ IDEA, we need to suspend it, which will render the IDE unresponsive. Therefore, we need an extra IDE instance that will remain functional and serve as our debugging tool.
To manage several IDE instances, I will be using JetBrains Toolbox App. This is an app that organizes your JetBrains IDEs. With it, you can install several versions of the same IDE or create shortcuts for running them with different sets of VM options.
Let’s install two instances of IntelliJ IDEA:
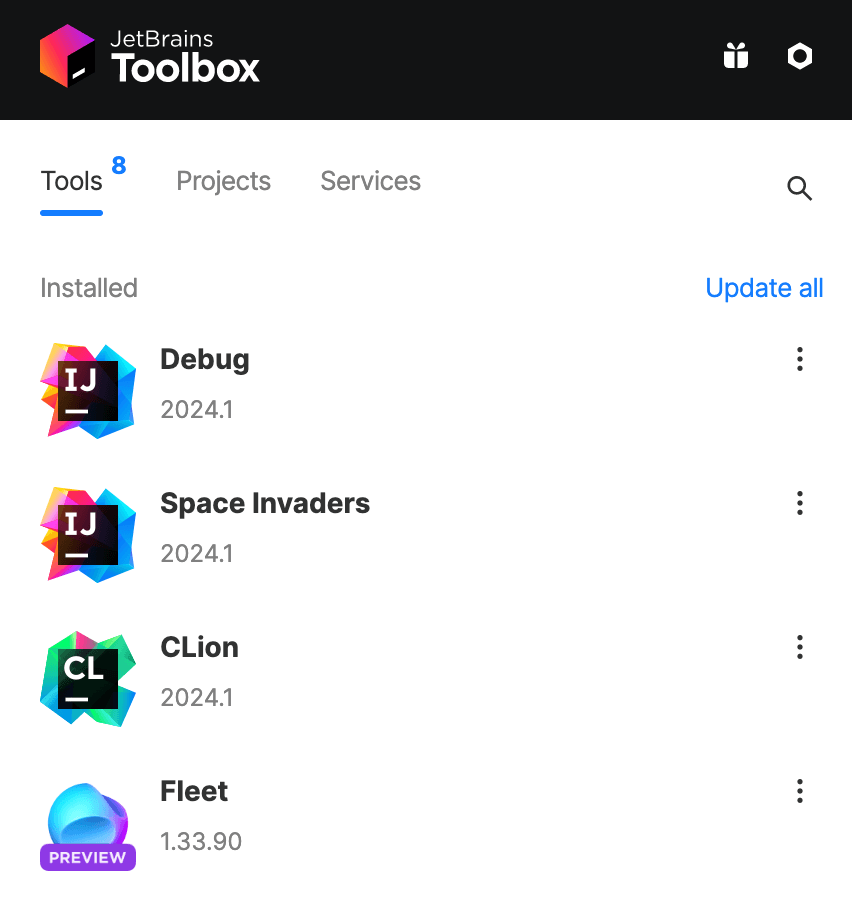
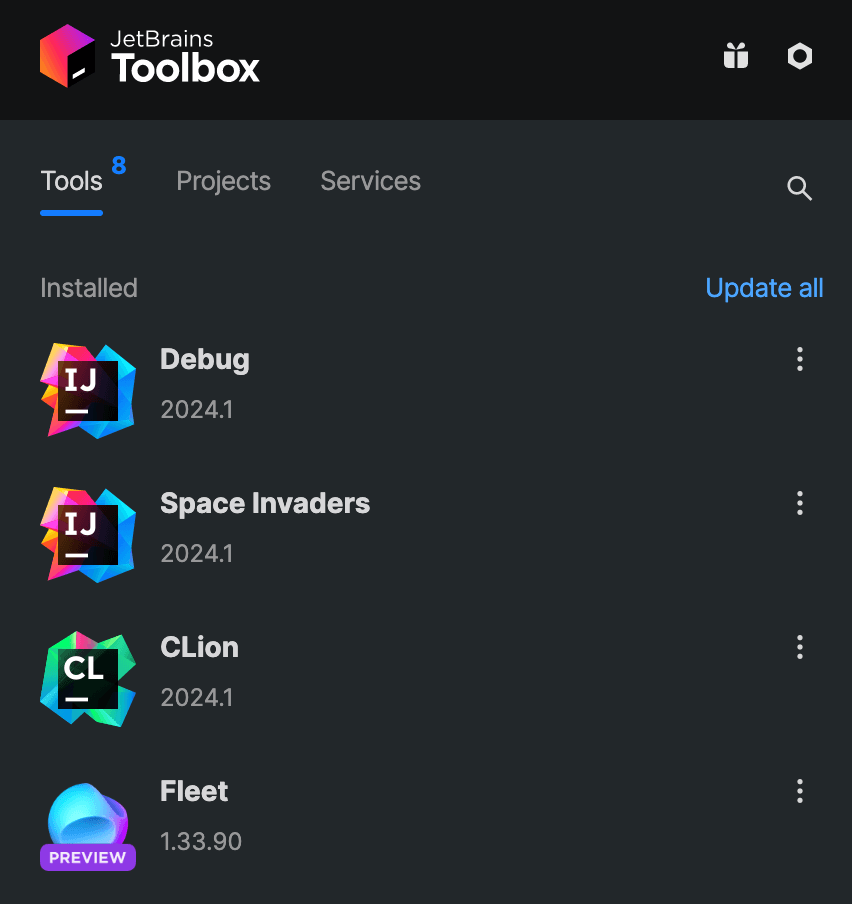
If you are using the same IDE version for both instances, make sure to specify different system, config, and logs directories in Tool actions | Settings | Configuration. On this page, you can also assign names to the IDE instances for convenience. I named them ‘Space Invaders’ and ‘Debug’.
To be able to debug the Space Invaders instance, click Tool actions near it, then go to Settings | Edit JVM options. In the file that opens, paste the following line:
-agentlib:jdwp=transport=dt_socket,server=y,suspend=n,address=*:5005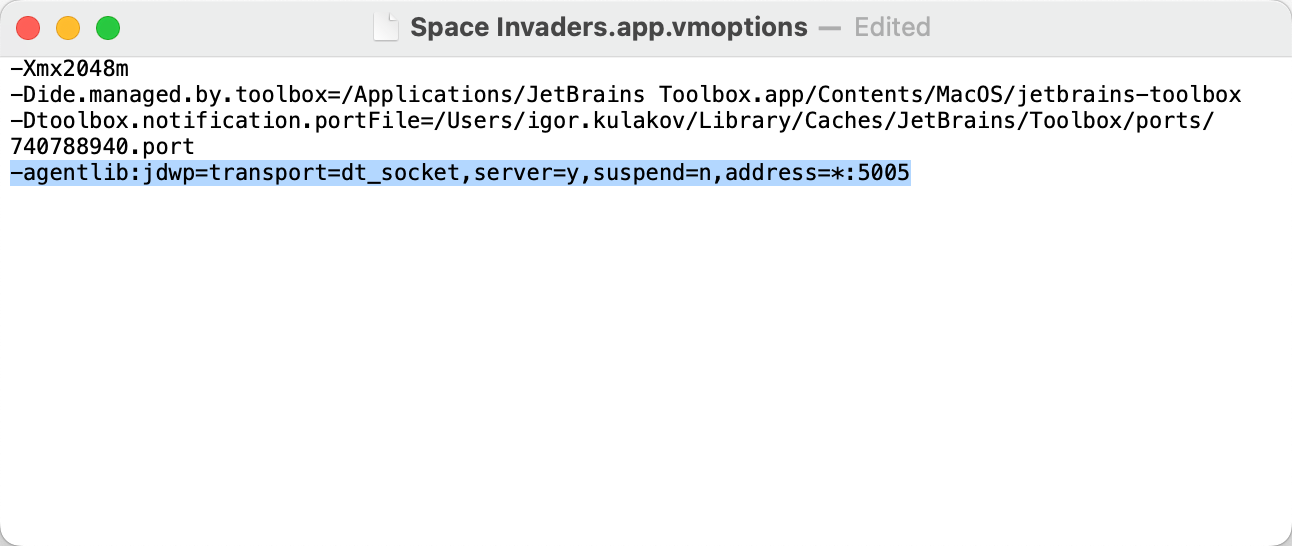
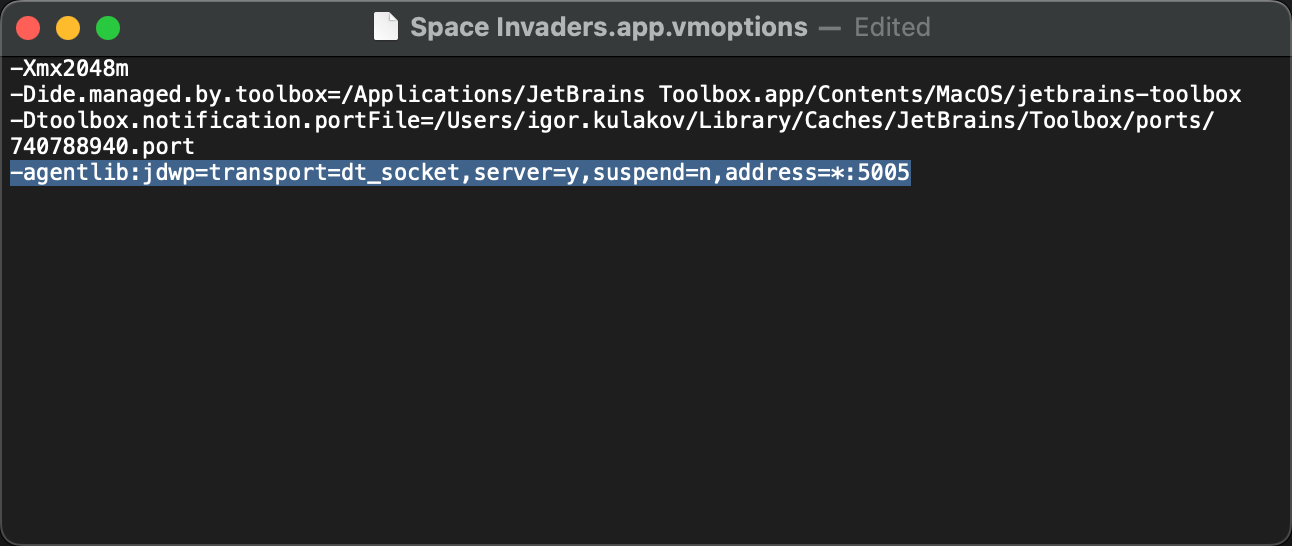
This will make the target JVM run with the debug agent and listen to incoming debugger connections
on port 5005.
Run the game
Run the ‘Space Invaders’ instance, install the game,
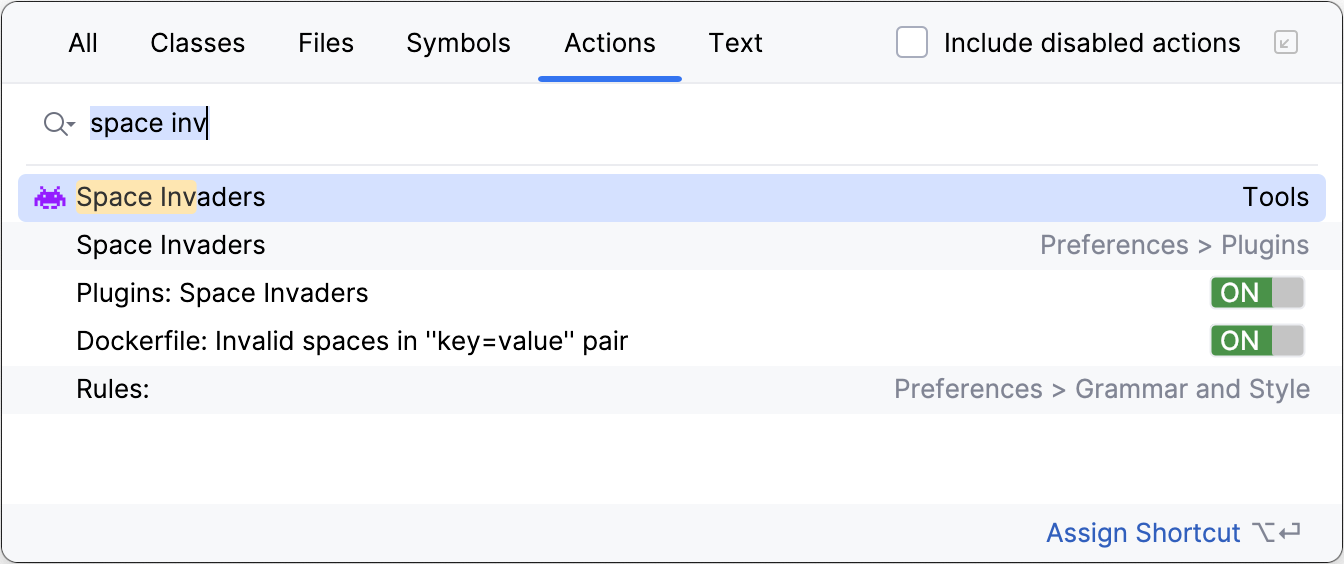
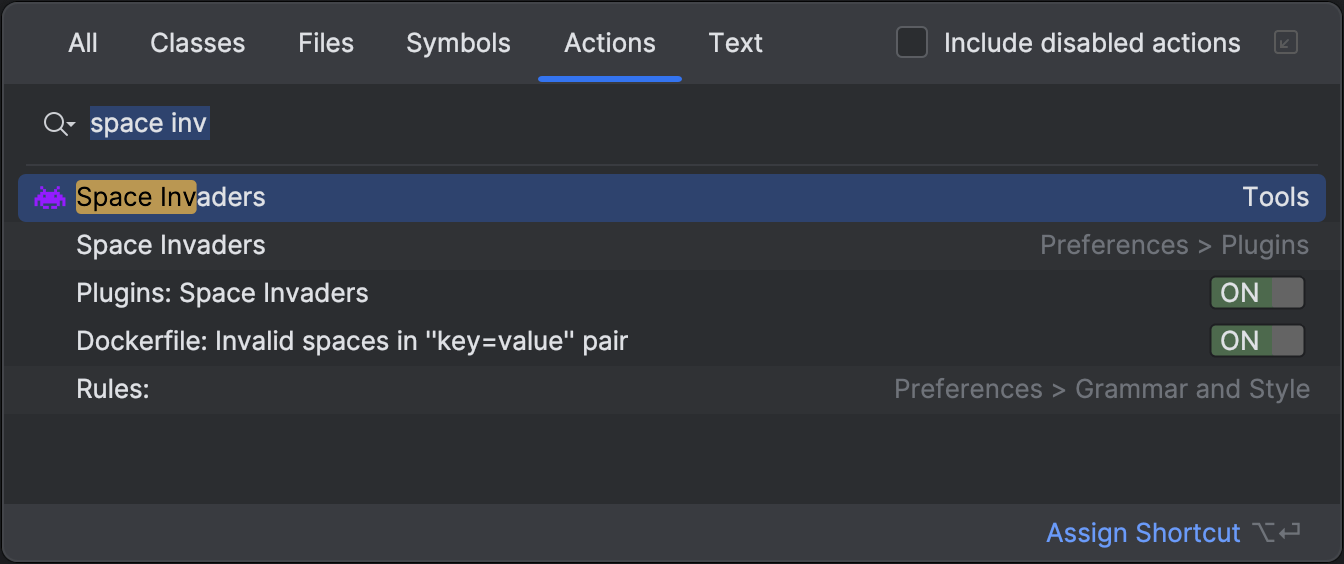
and launch it by running the Space Invaders action.
To find the action, hit Shift twice, and start typing Space Invaders:
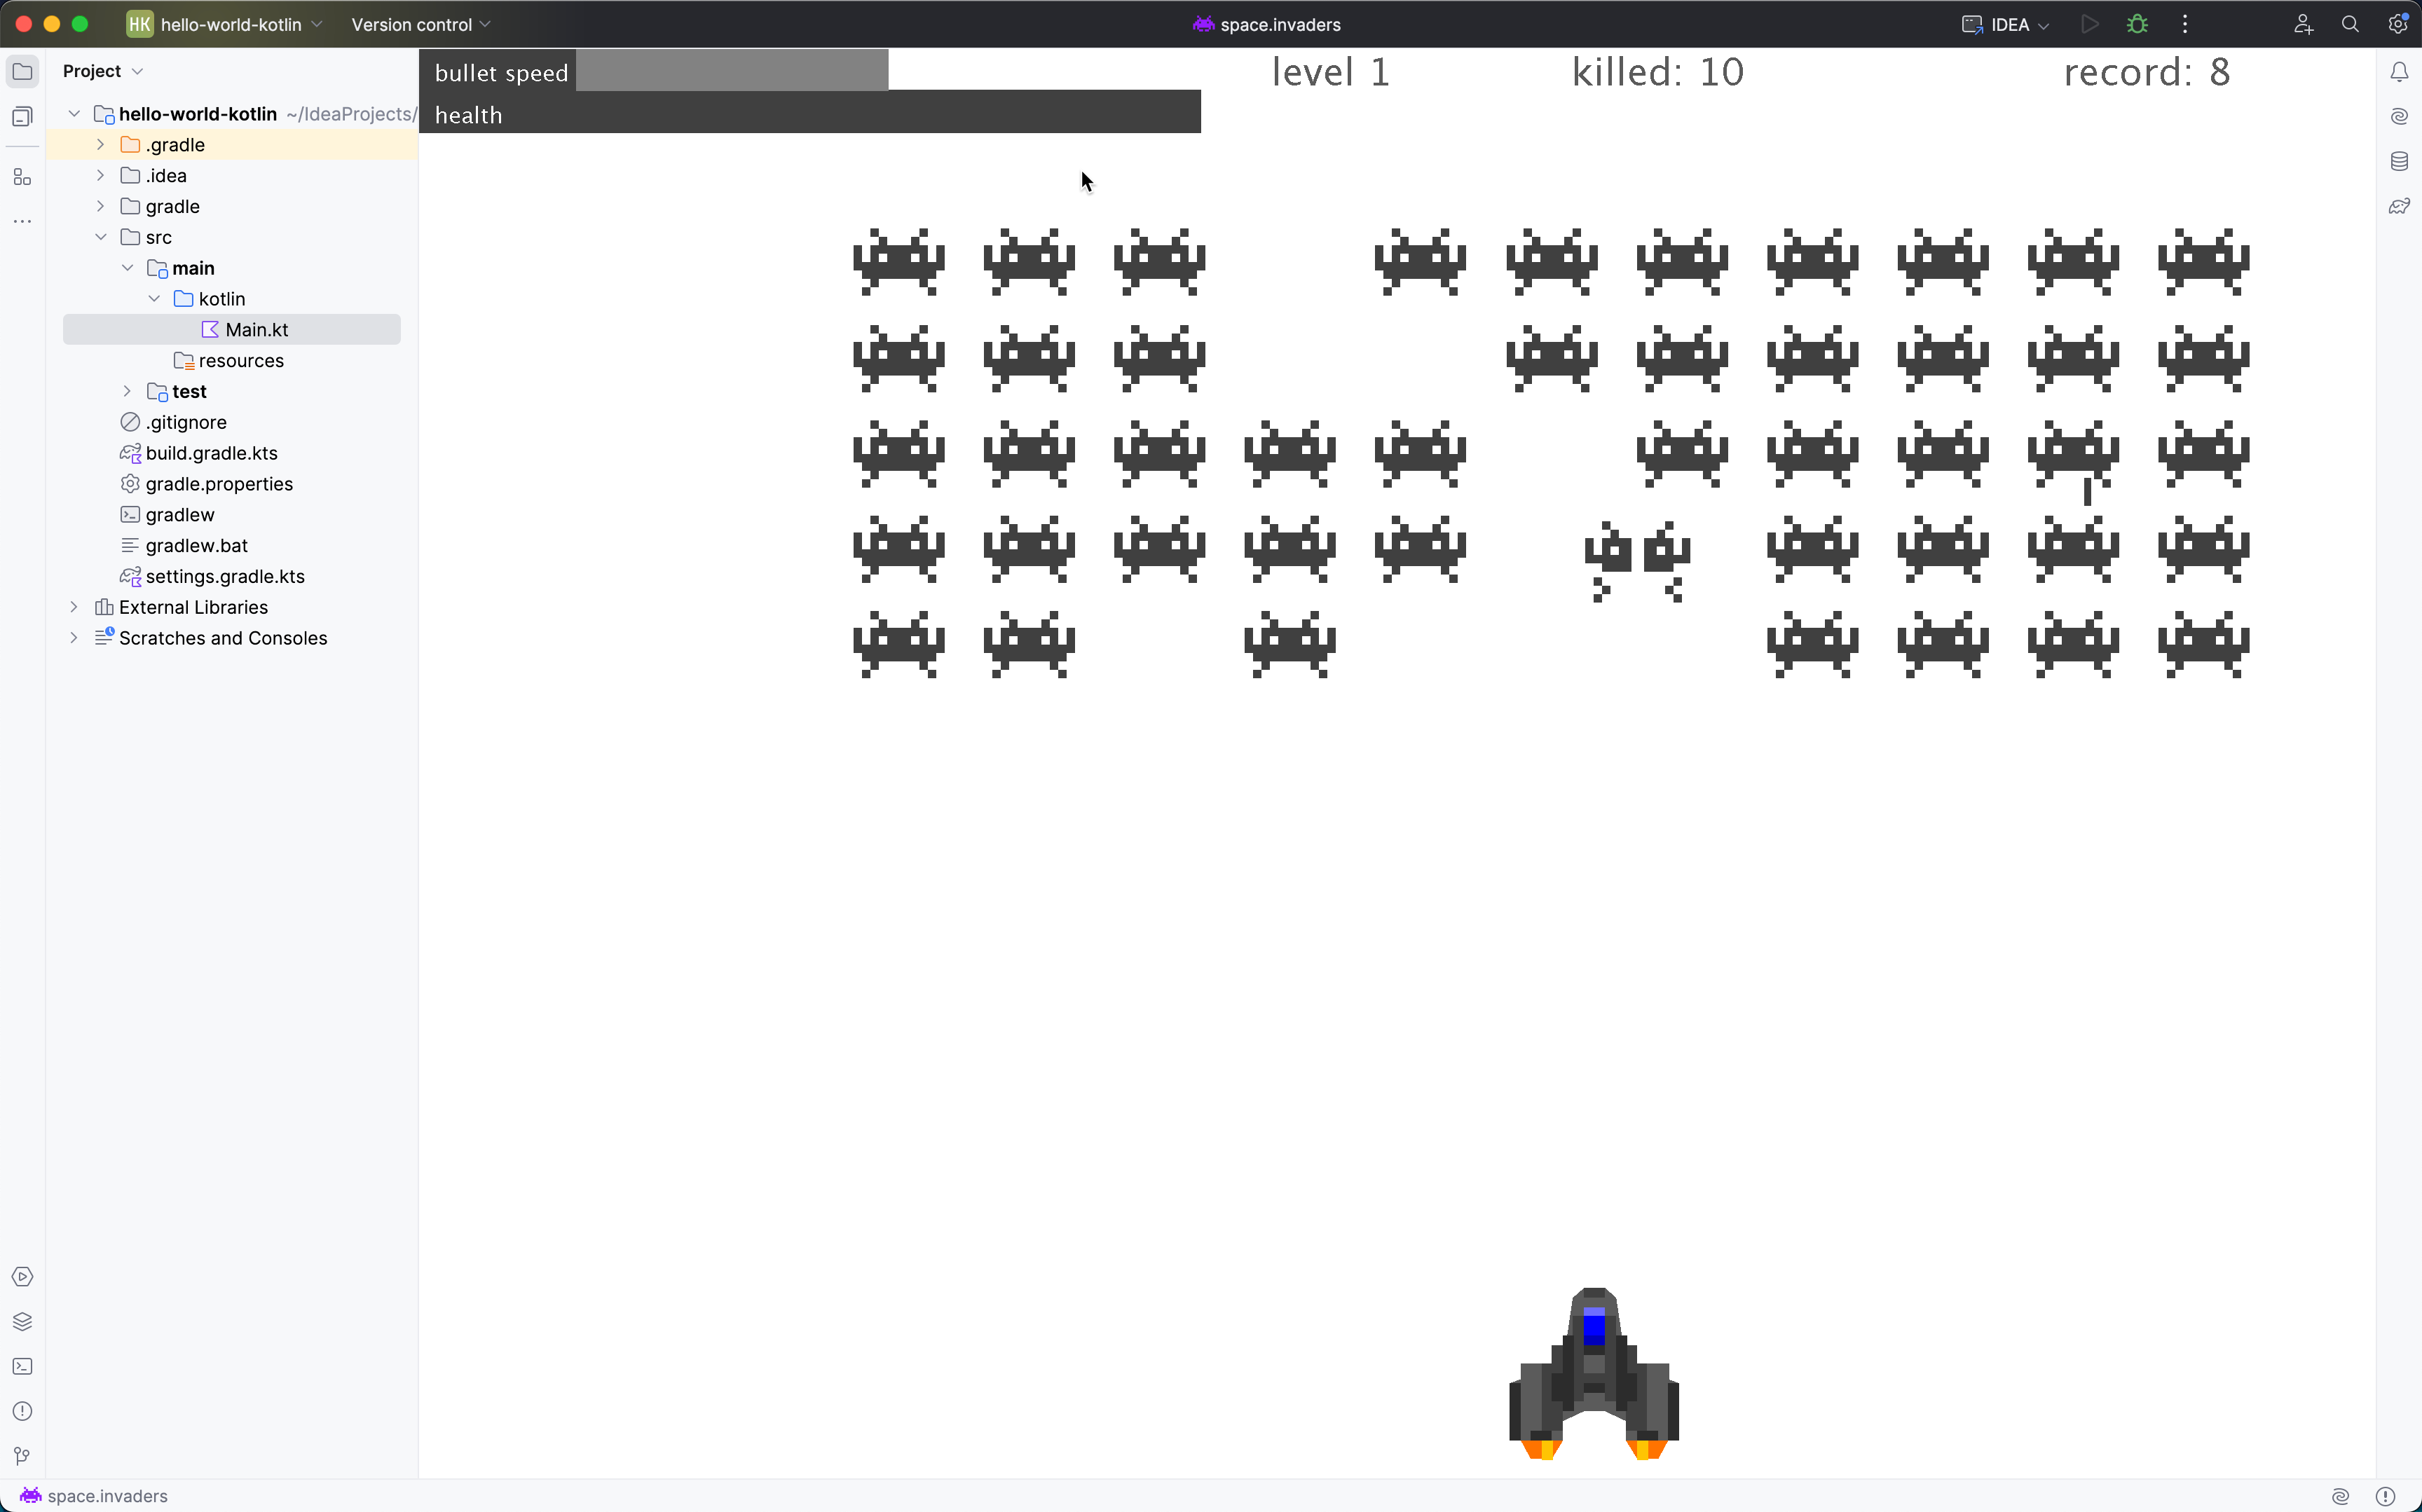
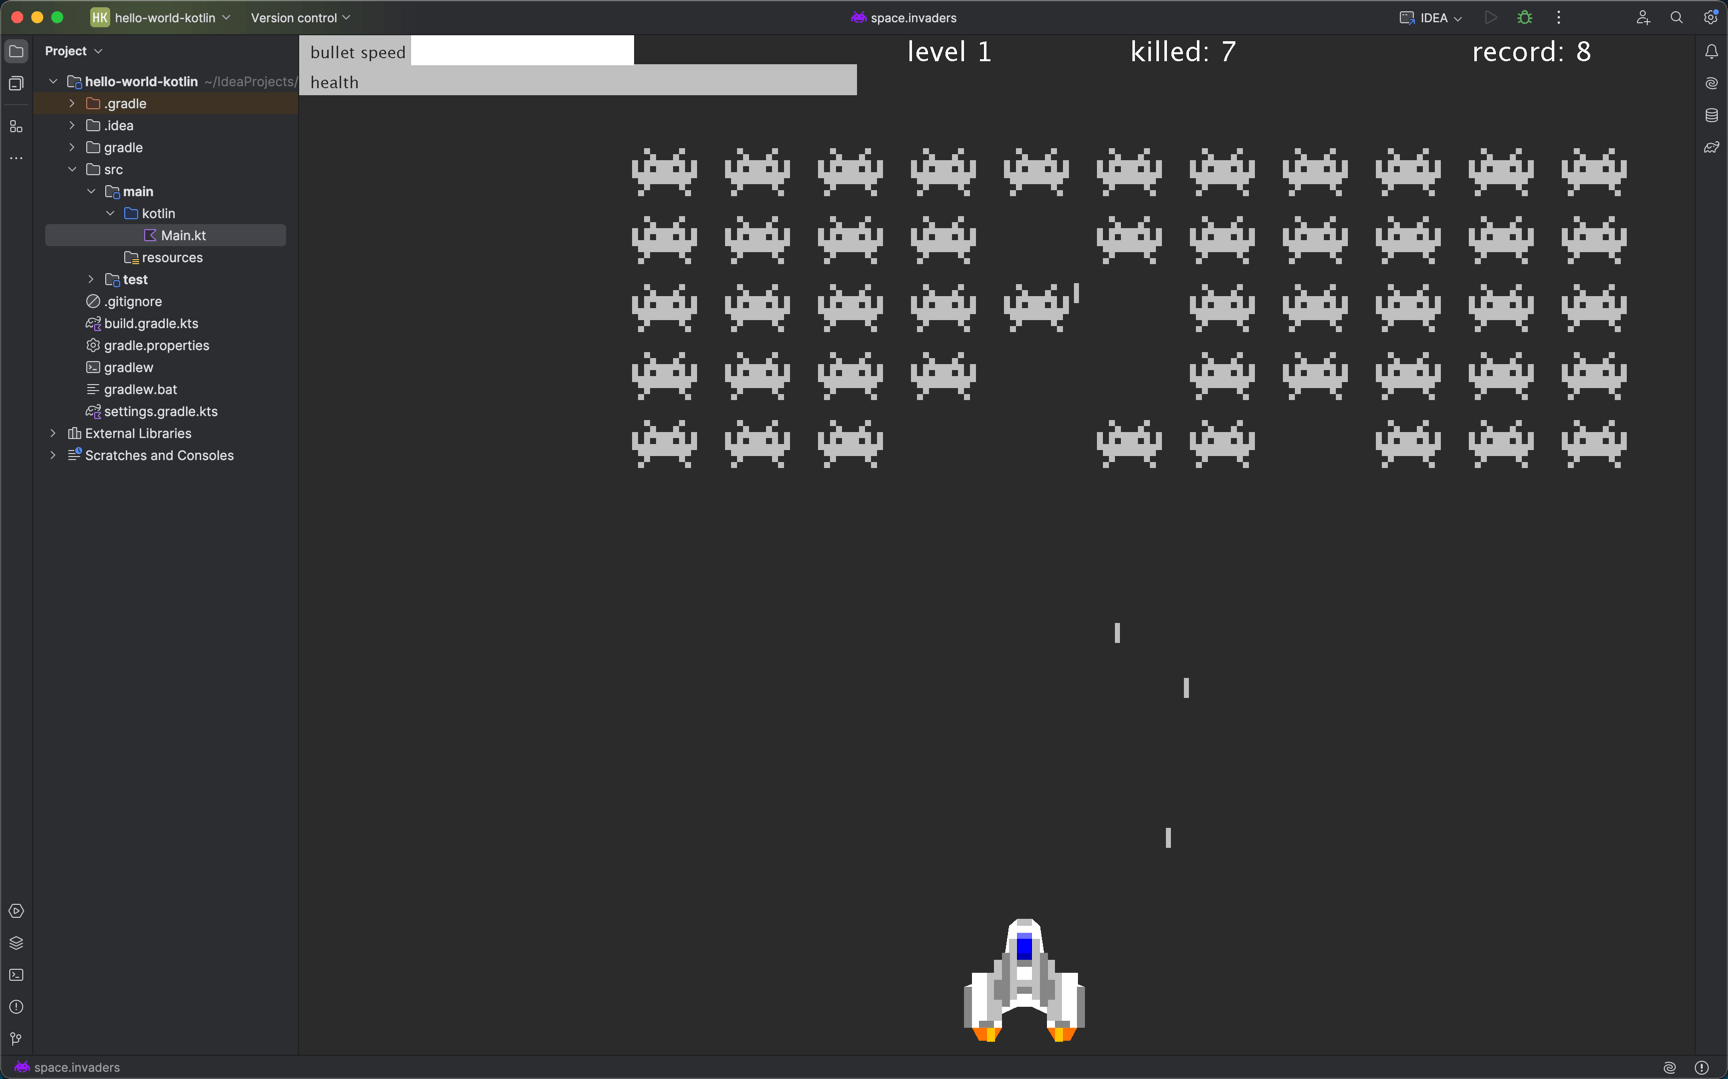
Let’s play for a while and observe the behavior that we want to fix: when enemy missiles hit the spaceship, we lose health from the health bar in the top left corner.
Attach and suspend
Our debugging journey begins with opening the ‘Debug’ IDE instance and setting up a new Kotlin project. We need this project primarily because it would not be possible to launch the debugger without one.
Additionally, IntelliJ IDEA includes the Java/Kotlin standard library in the new project template, which we might use later. I’ll explain the use of the standard library in the subsequent chapters.
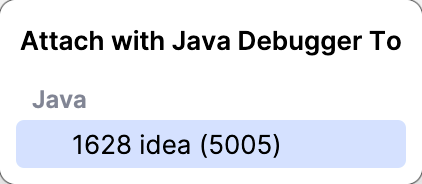
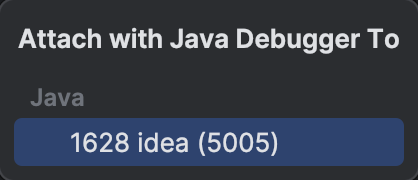
After creating the project, go to the main menu and select Run | Attach to Process. This will show the list of local JVMs listening for debugger attach requests. Select the other running IDE from the list.
We should see the following message in the console confirming that the debugger has successfully attached to the target VM.
Connected to the target VM, address: 'localhost:5005', transport: 'socket'Now we’re getting to the interesting part: how do we suspend the application?
Typically, we would set a breakpoint in the application code, but in this case, we lack the sources for both IntelliJ IDEA and the Space Invaders plugin. Not only does this prevent us from setting a breakpoint, but it also complicates our understanding of how the program operates. At first glance, there appears to be nothing to inspect or step through.
Luckily for us, IntelliJ IDEA has a feature known as Pause Program. It allows you to suspend the program at an arbitrary point in time, without needing to specify the corresponding line of code. You can find it in the debugger toolbar or in the main menu: Run | Debugging Actions | Pause Program.
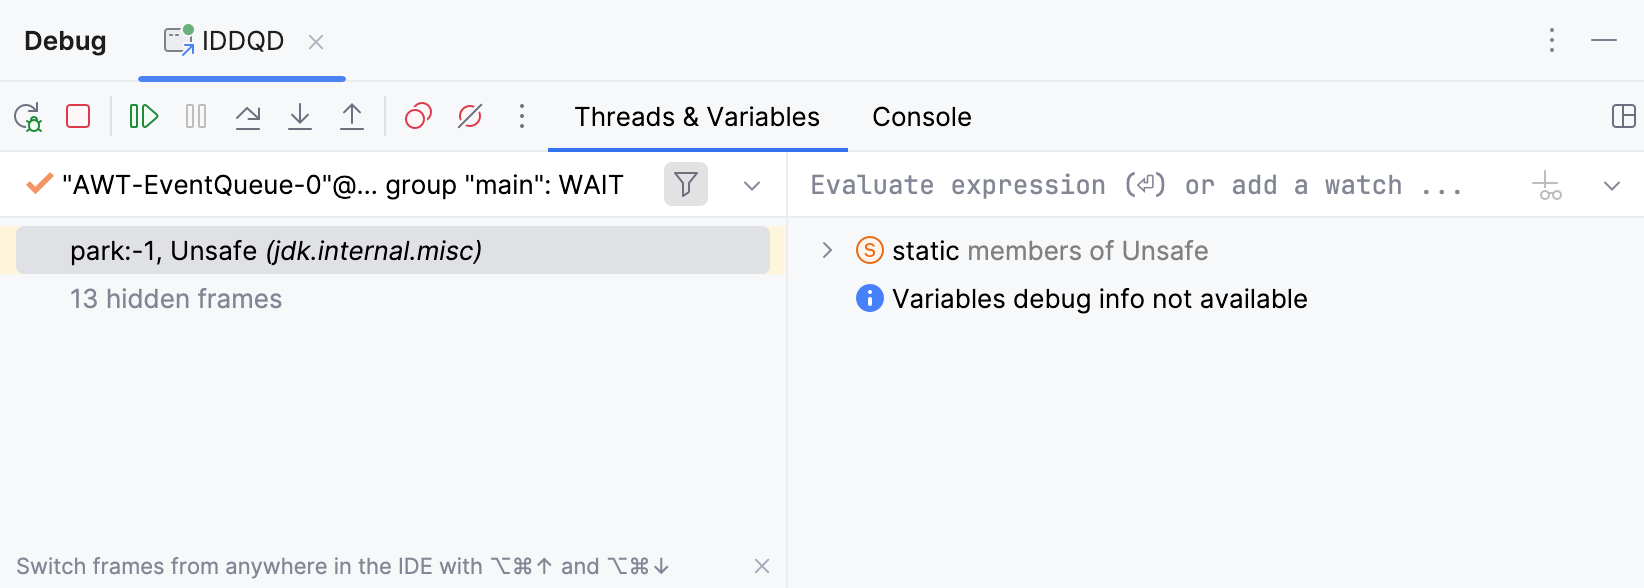
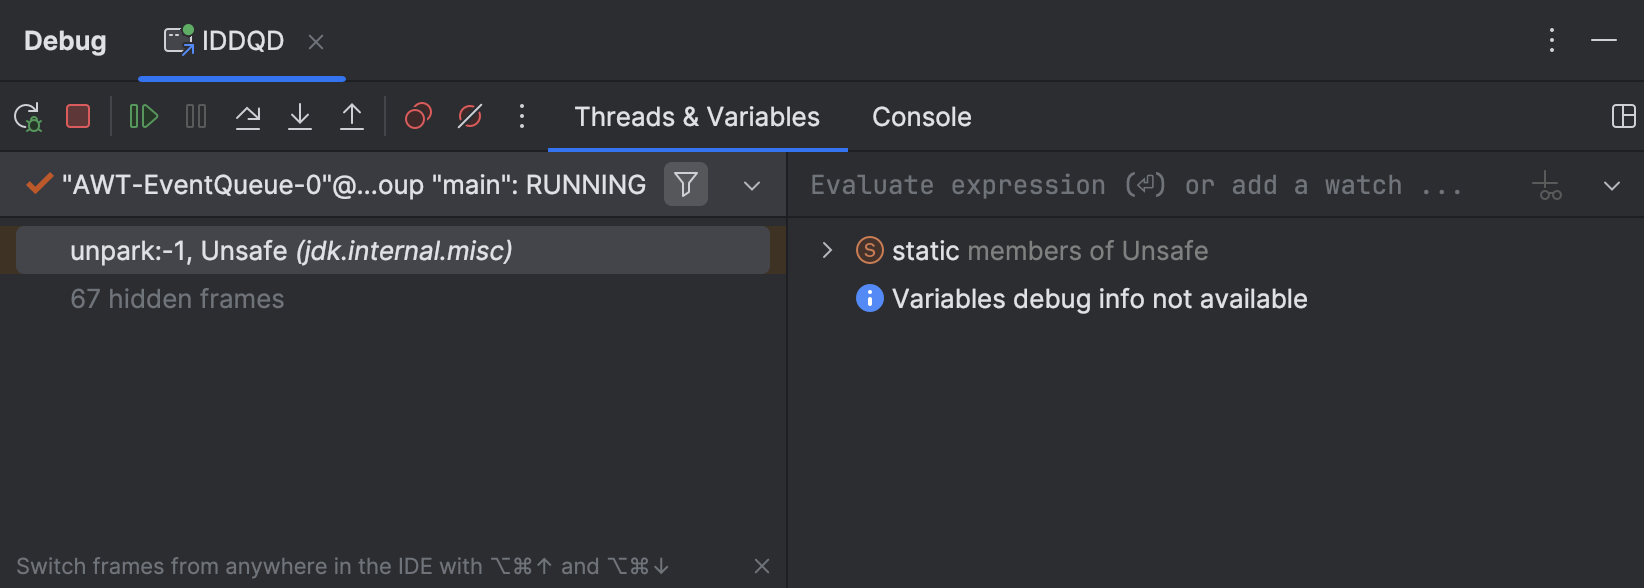
The application gets suspended, giving us a starting point for debugging.

Pause Program is a very powerful technique, which is especially helpful in several advanced scenarios. To learn more, check out the related articles:
Find the relevant objects
If we look at our goal in programming terms, it boils down to preventing the spaceship’s health from going down. Let’s find the object that holds the corresponding state.
Since we don’t know anything about the plugin code, we can directly inspect the heap using the IntelliJ IDEA debugger’s Memory view:
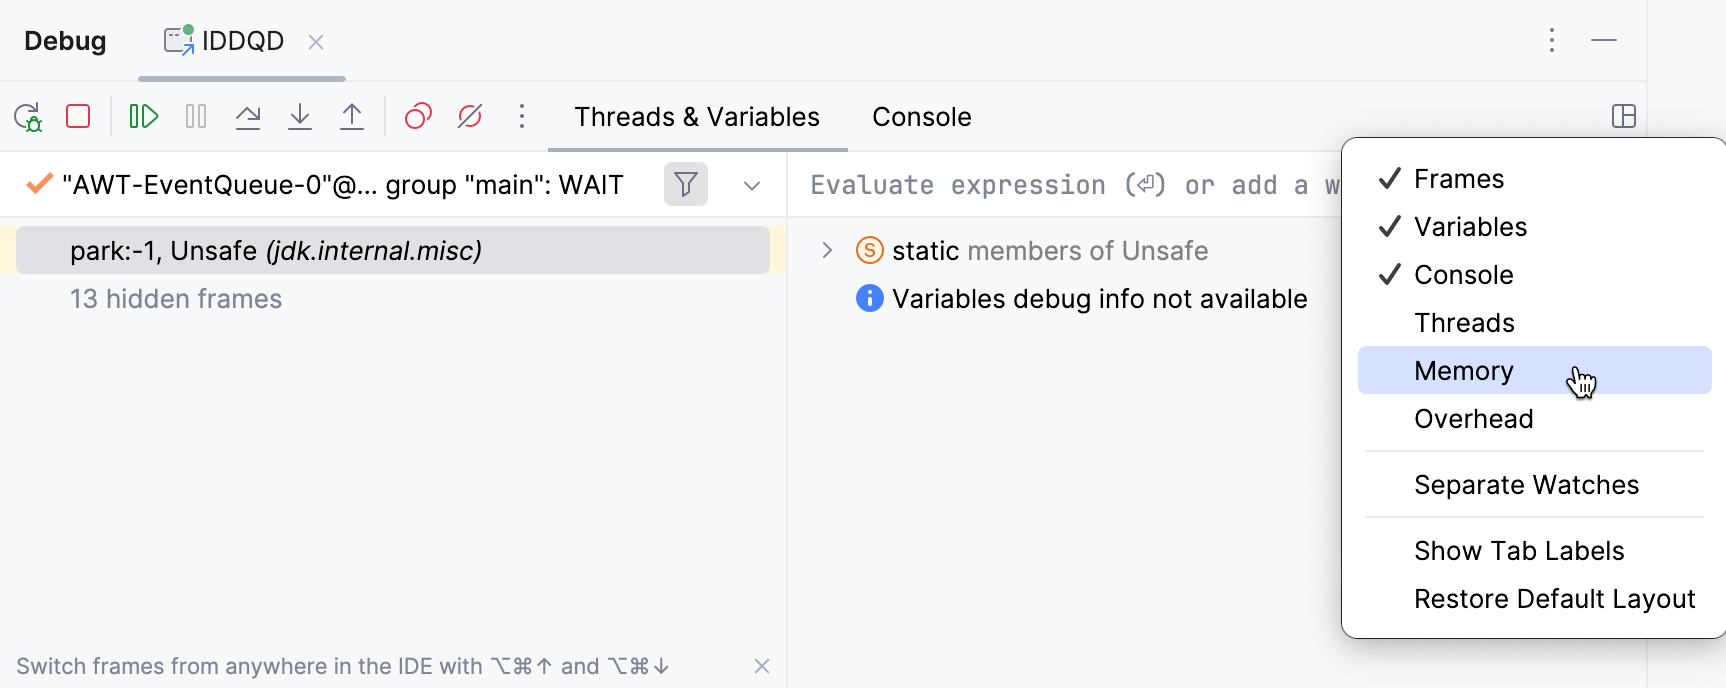
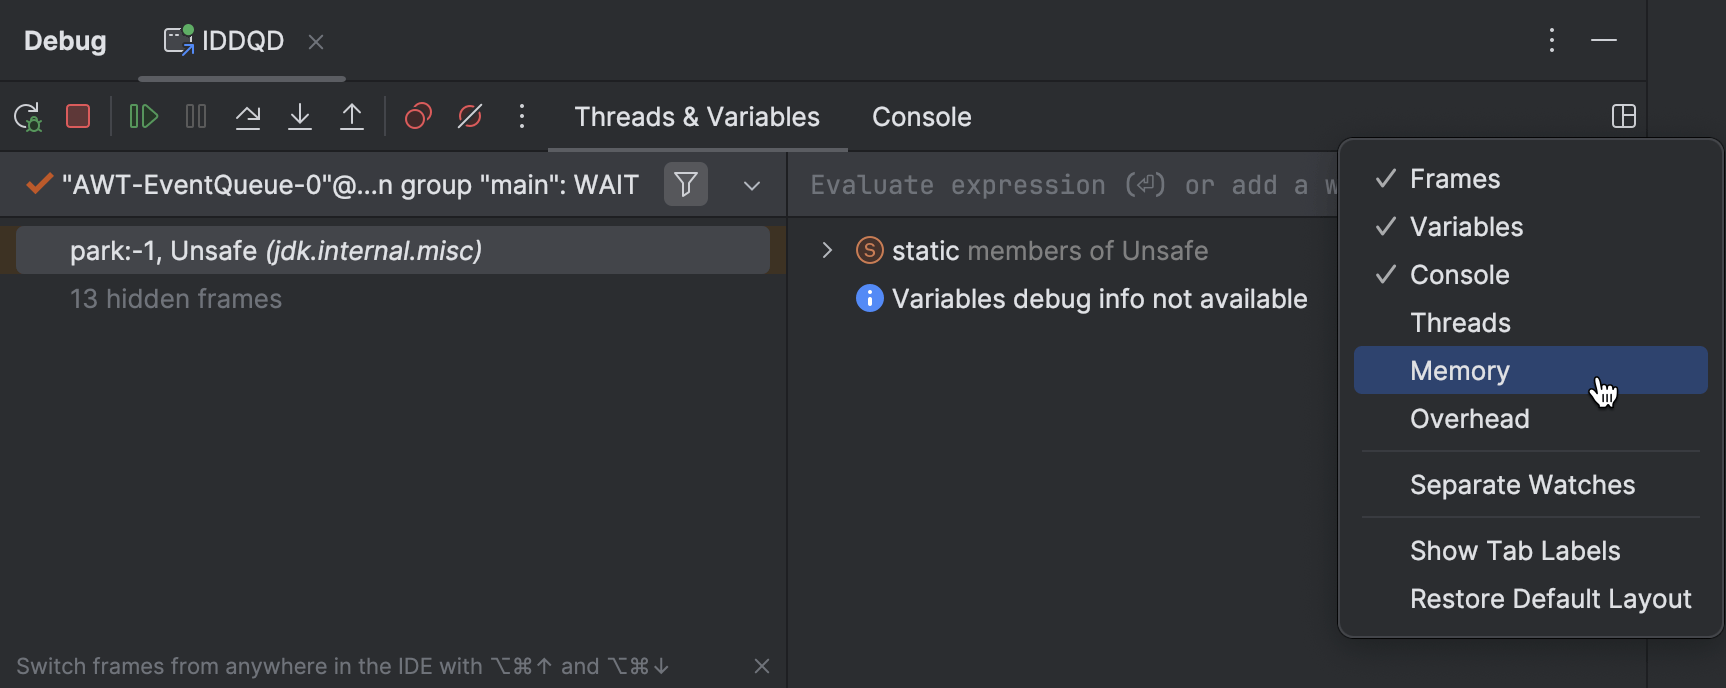
This feature gives you information about all objects that are currently alive.
Let’s type invaders and see if we can find anything:
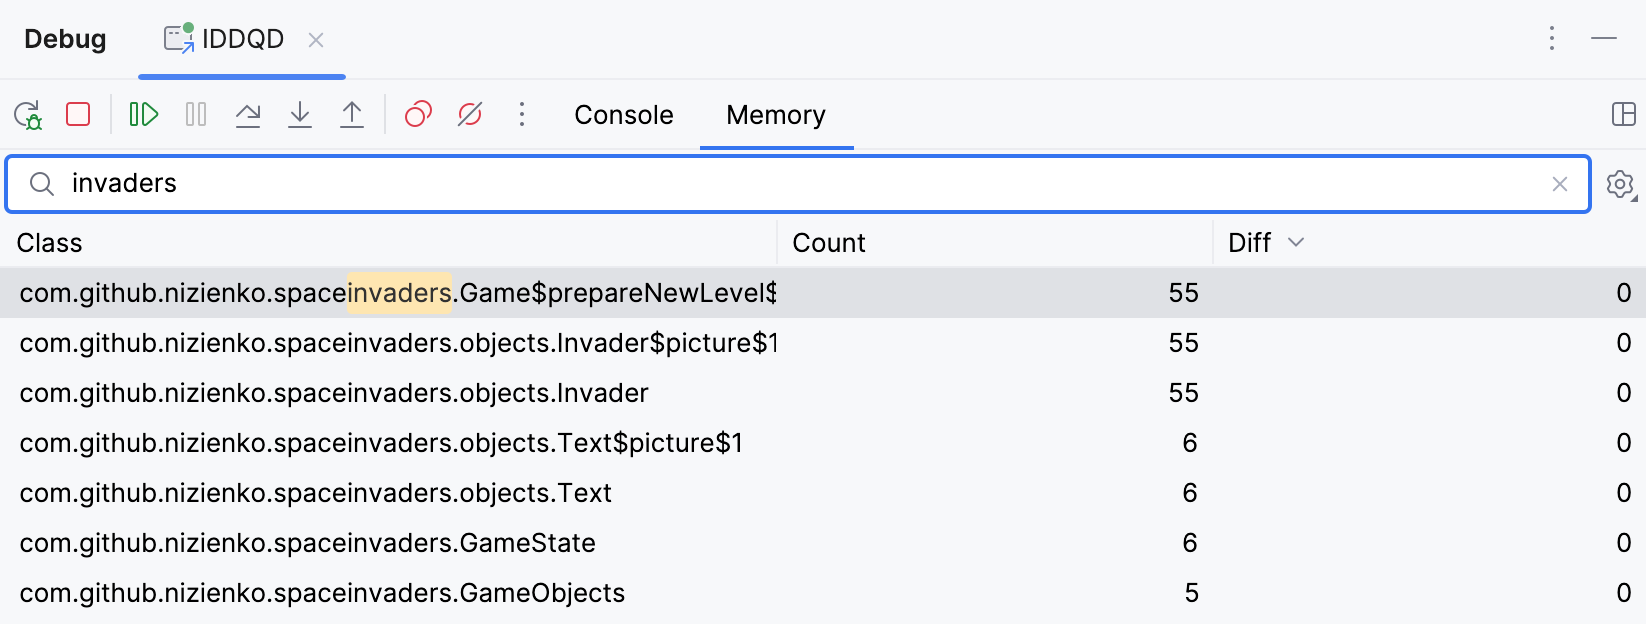
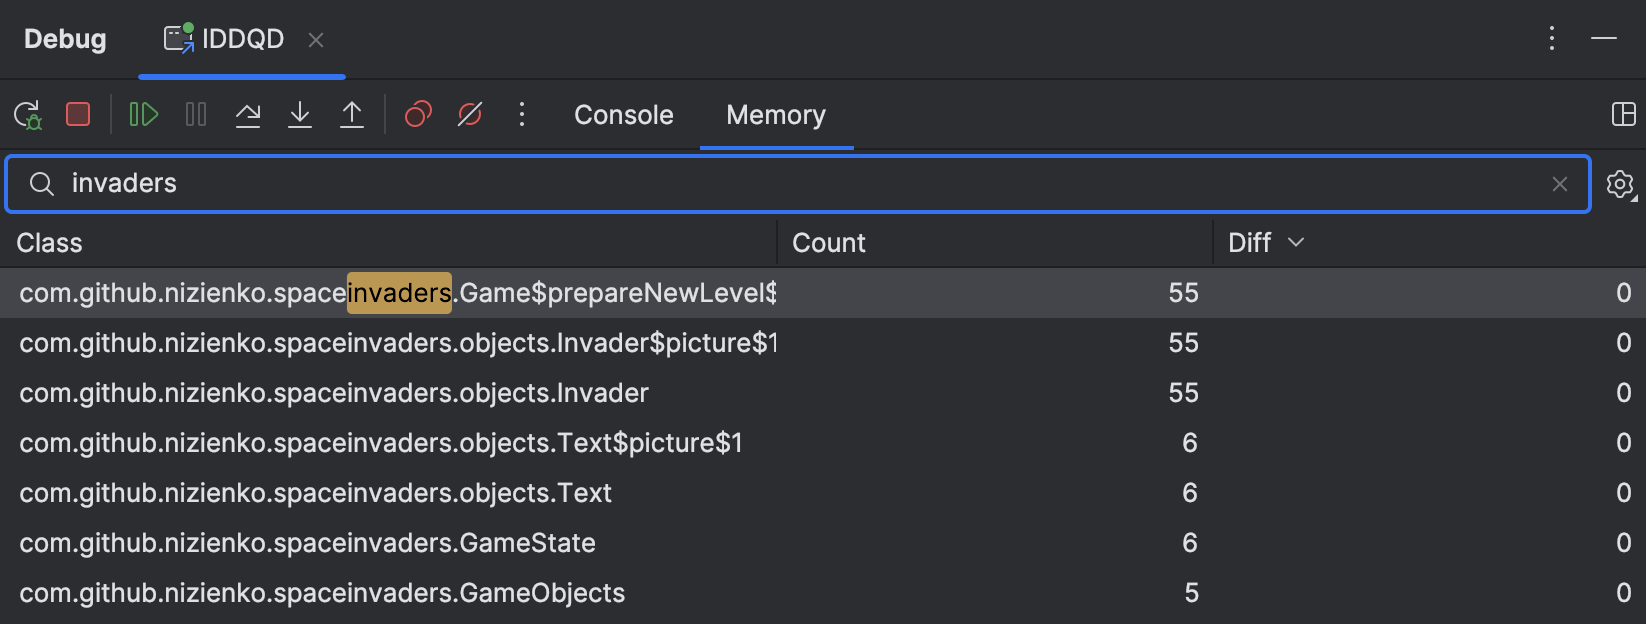
Apparently, the plugin classes come under the package com.github.nizienko.spaceinvaders .
Within this package, there is a class called GameState , which has several live instances.
At first glance, this looks like what we need.
Double-clicking GameState shows all the instances of this class:
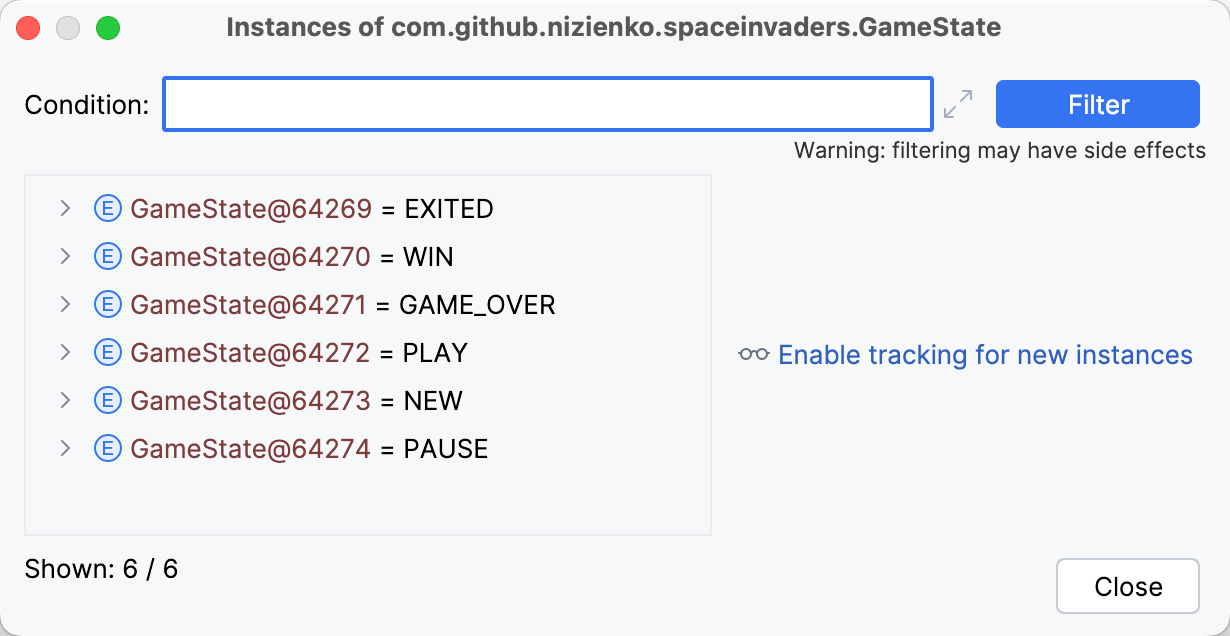
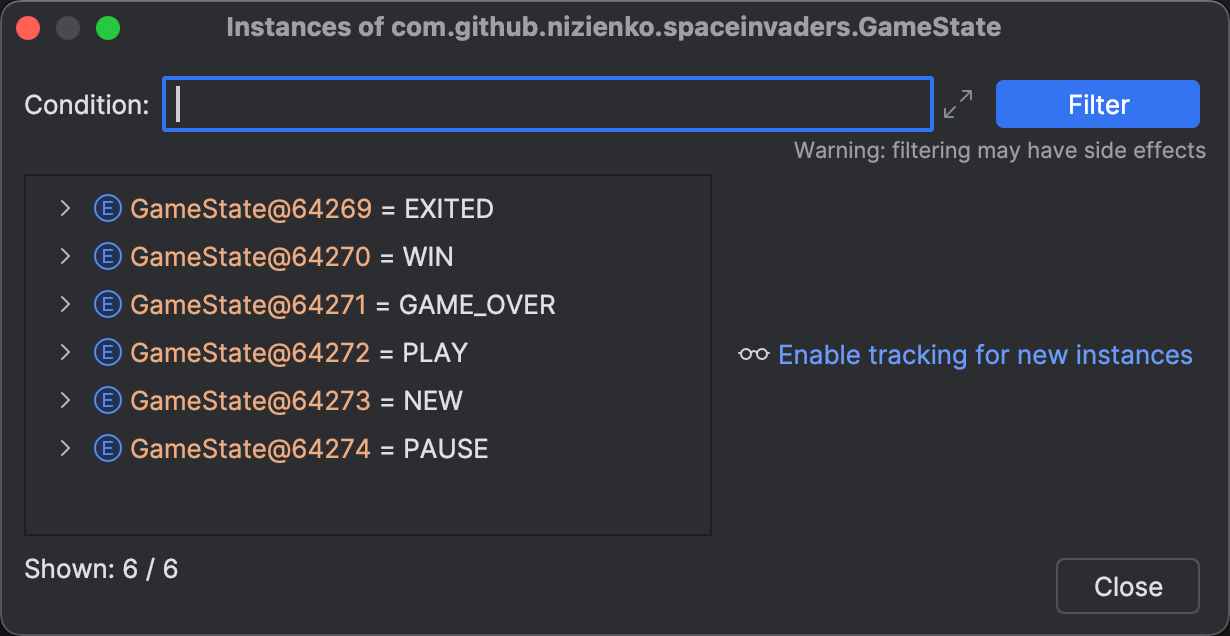
As it turns out, it’s an enum – which isn’t exactly what we were looking for.
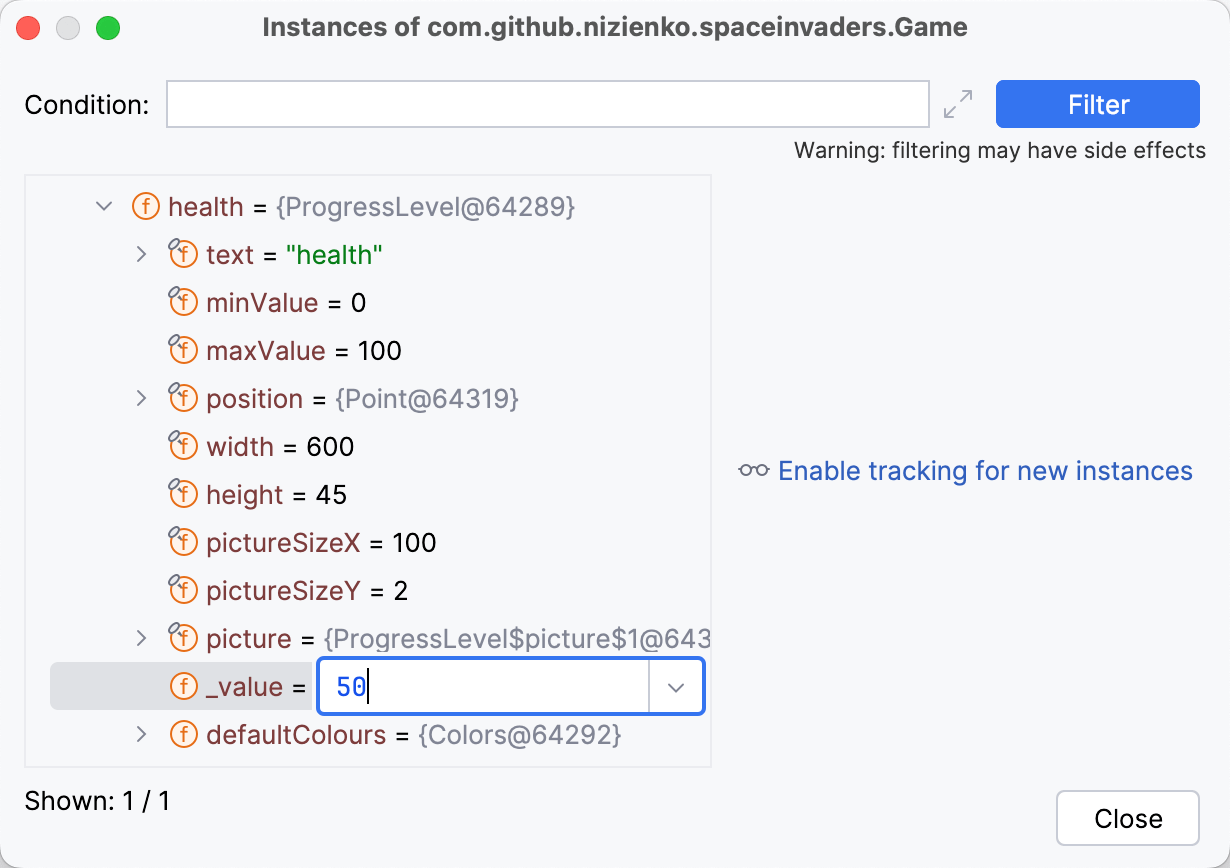
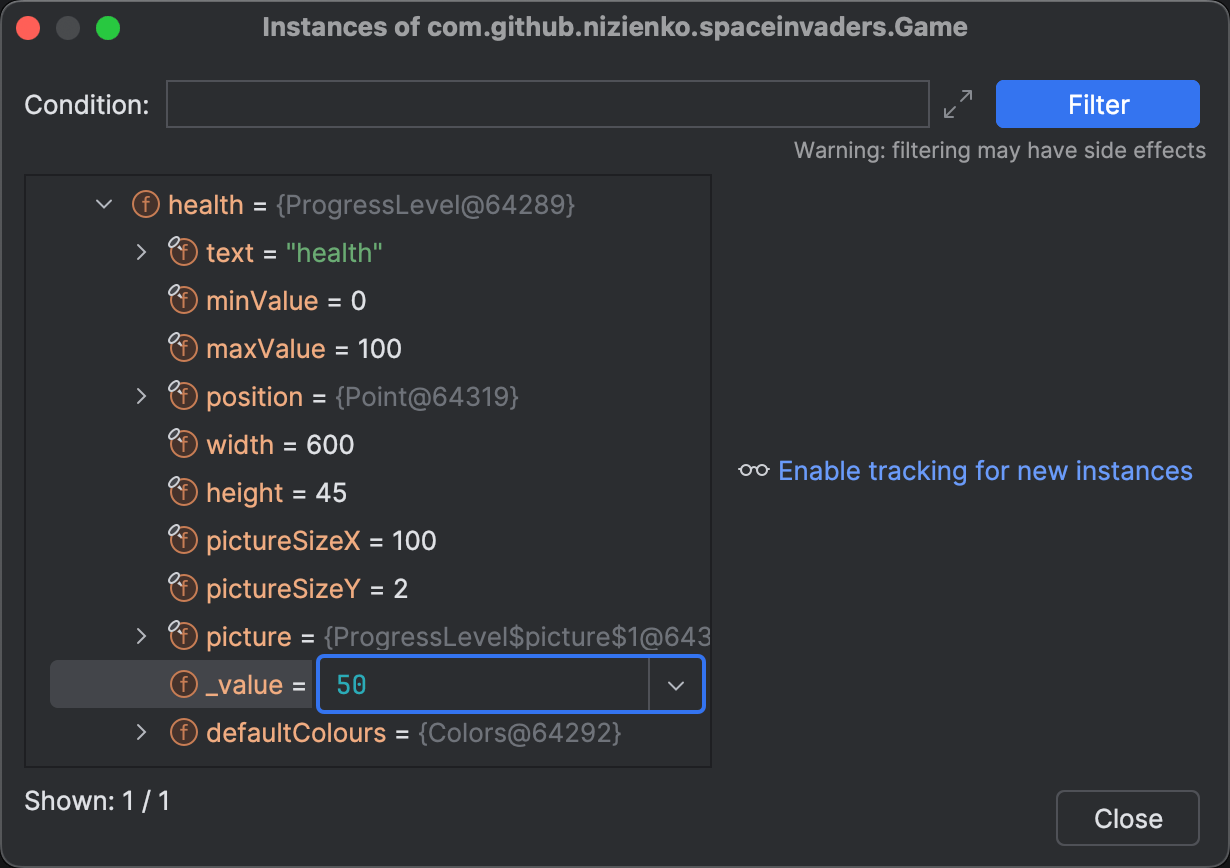
Continuing our search, we stumble upon a single instance of Game .
Expanding the node lets us inspect the instance’s fields:
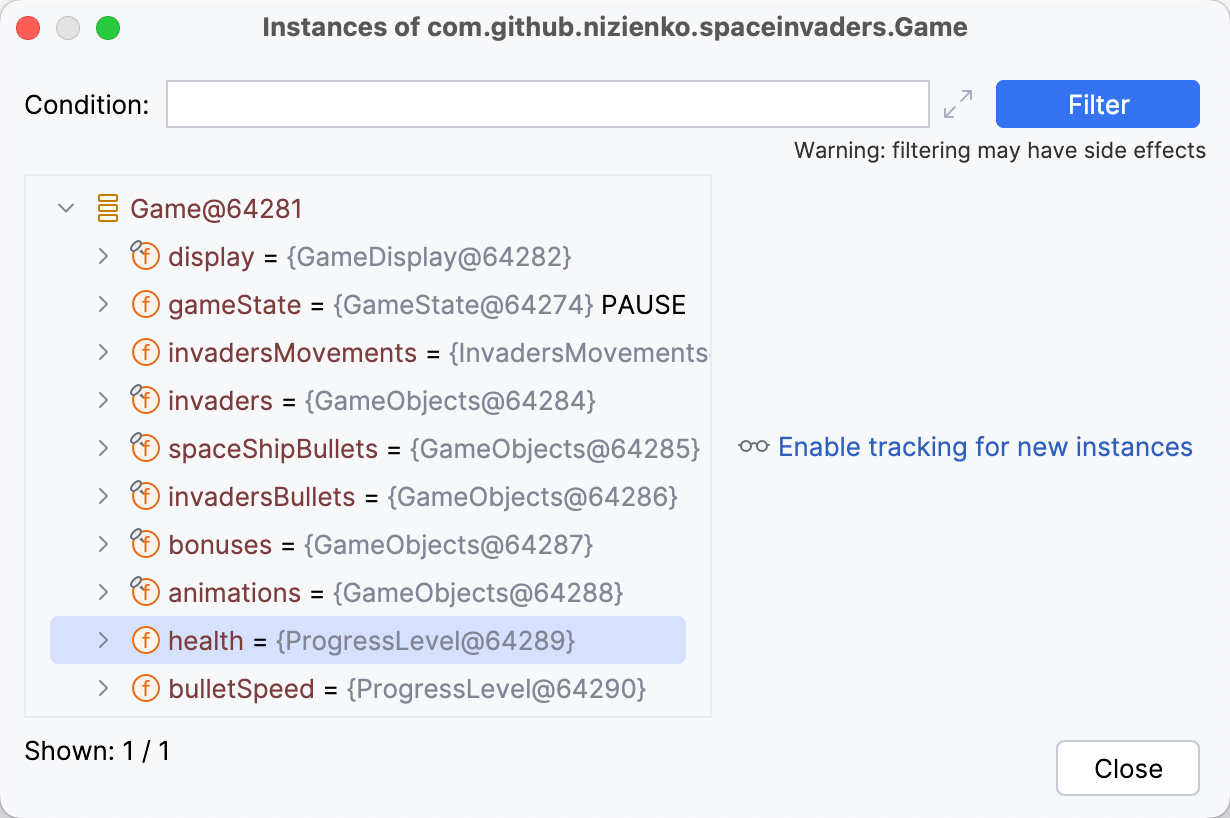
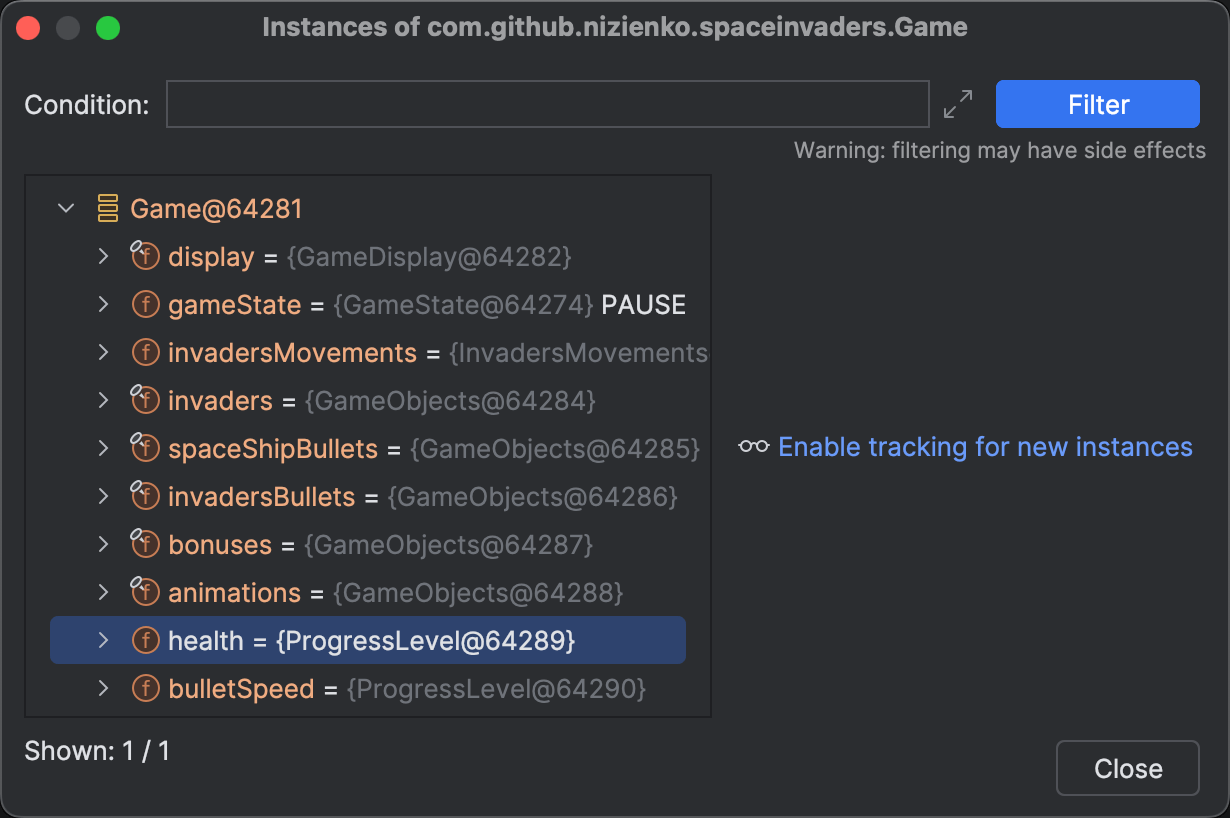
The health property appears to be the one of interest here.
Among its fields, we find one called _value .
In my case, the value is 100 , which correlates with
the health bar being full when I suspended the game.
So, it’s likely the correct field to consider, and its value seems to range from 0 to 100 .
Let’s put this hypothesis to the test.
Right-click _value , then select Set Value.
Choose a value that is different from your current one. For instance, I’ll choose 50 .
At this step, we bump into an error that reads Cannot evaluate methods after Pause action:
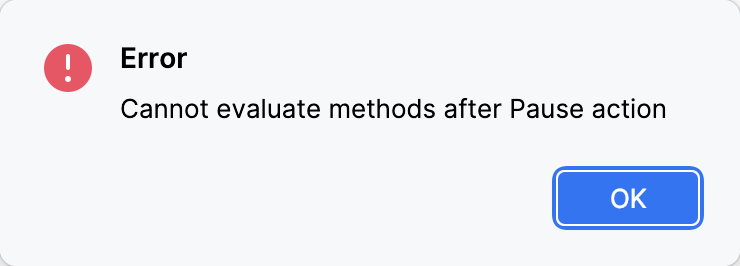
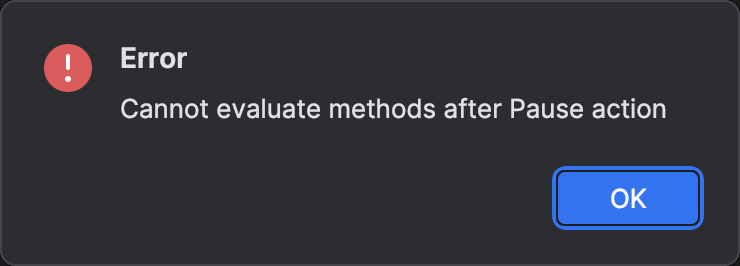
The problem arises because we used Pause Program instead of breakpoints, and this feature comes with some limitations. However, we can use a little trick to work around this.
I described it in one of the previous posts covering the Pause Program action. In case you missed it there, here’s what needs to be done: once the application is paused, perform a stepping action, such as Step Into or Step Over. Doing so will enable the use of advanced features like Set Value and Evaluate Expression.
Now we should be able to set the value for health .
Try modifying the value, then resume the application to see if the health bar displays any changes.
So we’ve located the object that holds the relevant state. At the very least, we can manually refill the health bar from time to time. We may not be fully out of the woods just yet, but we’re getting there.
Labels and expressions
Now that we have identified the object to focus on, it would be handy to mark it. In case you’re unfamiliar with debug labels, this is what a marked object looks like:
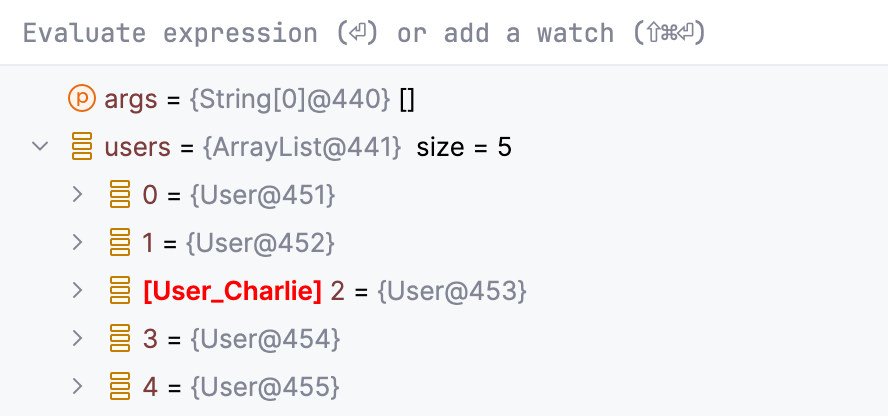
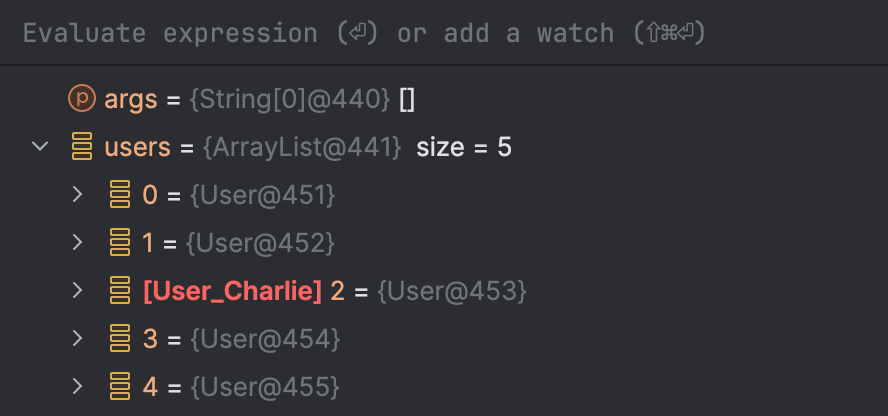
Labels can be beneficial in many ways. Within the context of this article, marking the relevant object ensures that we can directly use it in features like Evaluate Expression without being dependent on the current execution context.
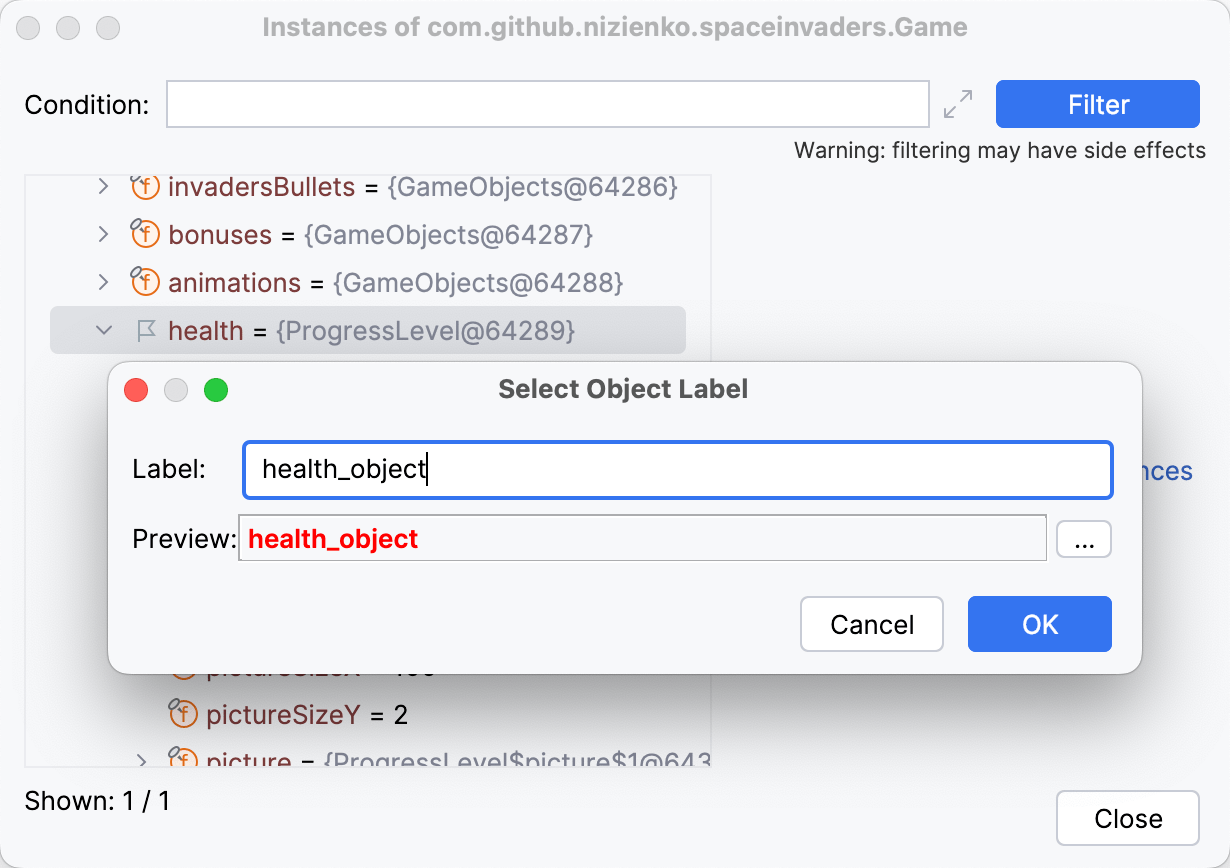
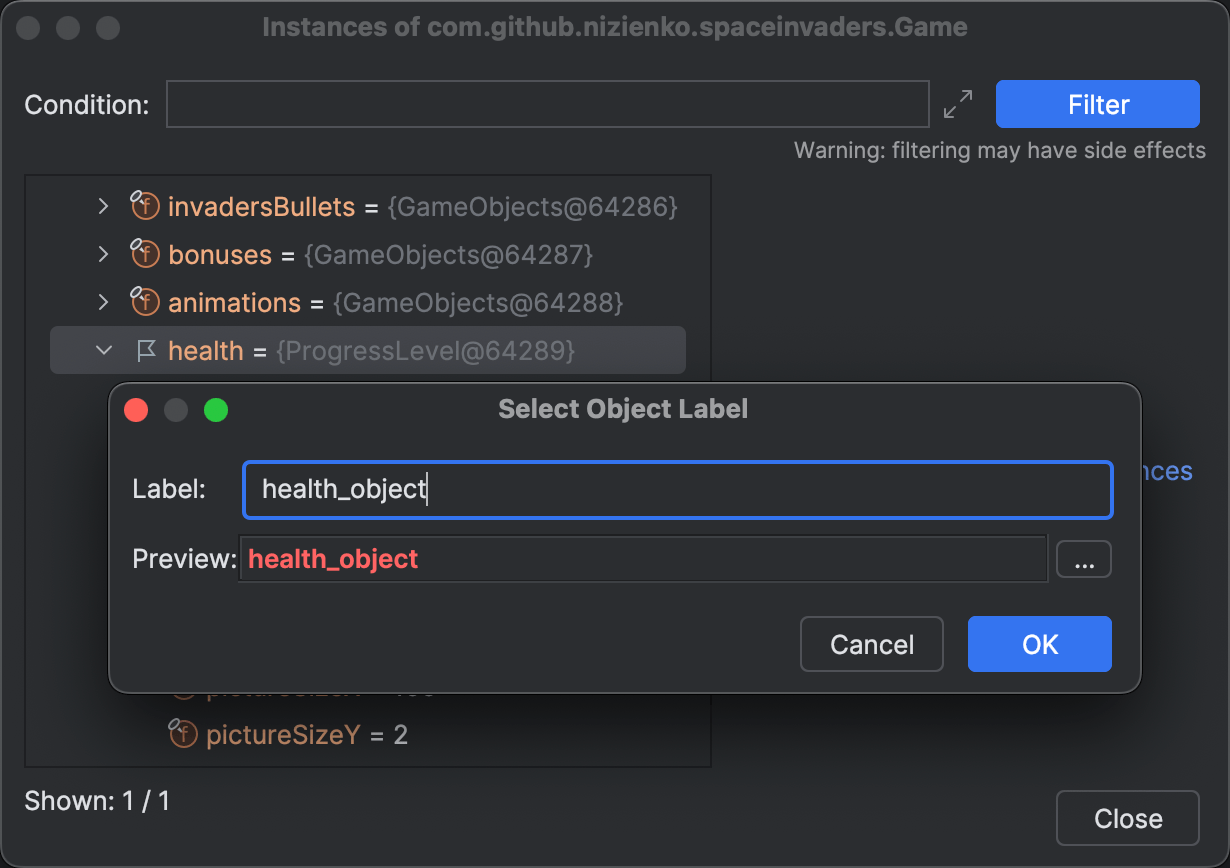
Unfortunately, it’s not possible to directly mark _value , but we can mark the object that encloses it.
To do this, right-click health , select Mark Object, and then give it a name.
We can now test how the label works elsewhere.
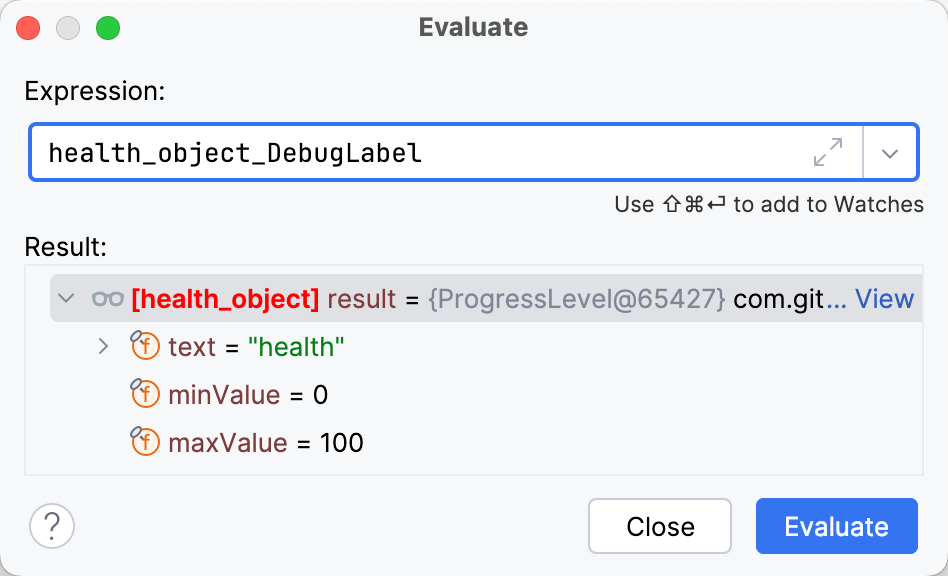
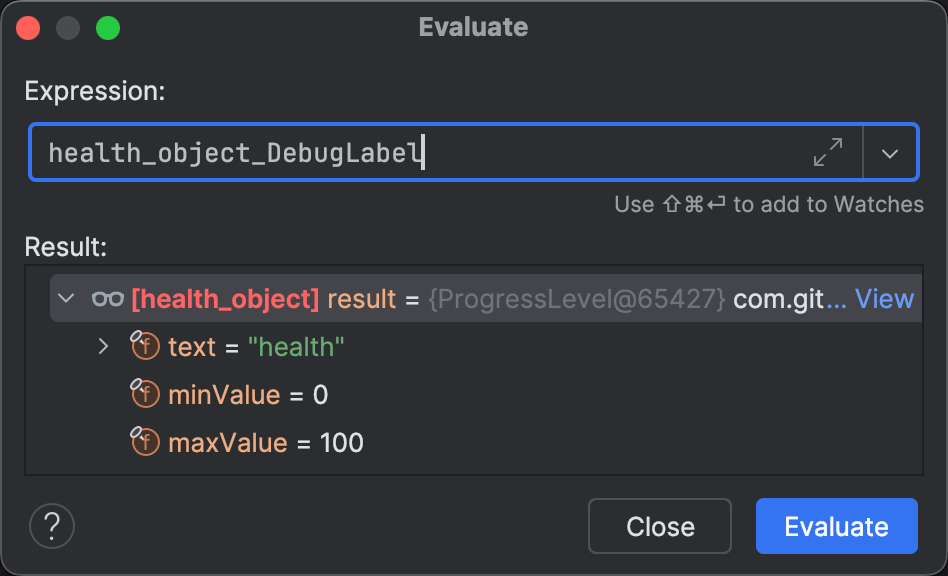
Open the Evaluate Expression
dialog and enter health_object_DebugLabel as the expression.
As you can see, the object is accessible from anywhere in the program through the Evaluate dialog:
What about changing the spaceship’s health from Evaluate?
health_object_DebugLabel._value = 100 does not work.
At the same time, _value appears to be a backing field of a Kotlin property.
If this is true, Kotlin must have generated a corresponding getter:
health_object_DebugLabel.getValue()The Evaluate dialog doesn’t think this is valid code, but we’ll try it anyway:
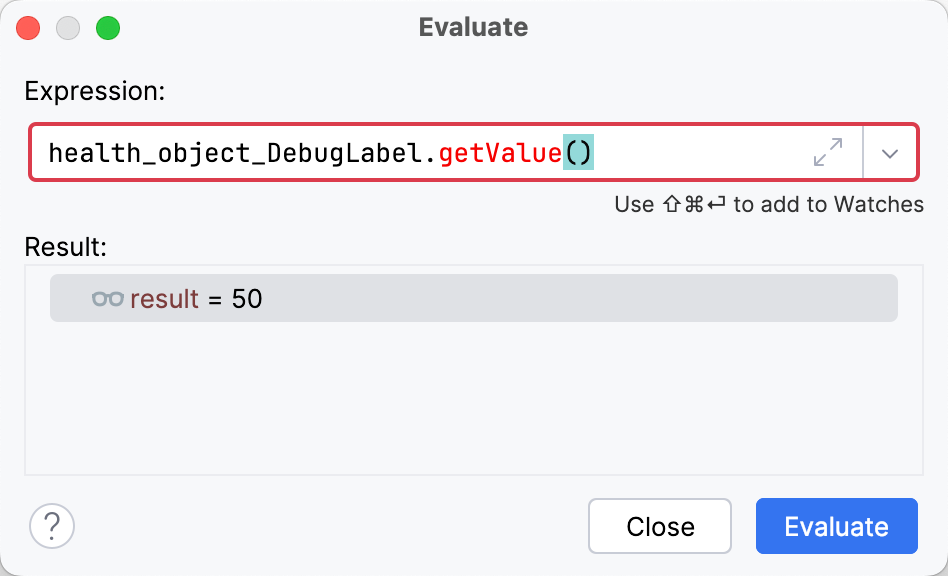
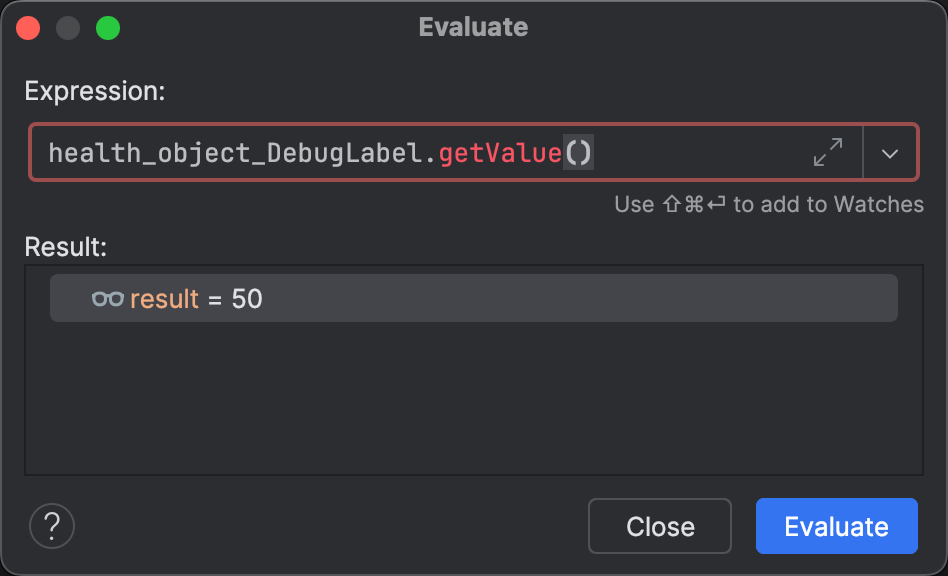
The expression returns the current spaceship’s health, so this approach works! As you would expect, the setter works, too:
health_object_DebugLabel.setValue(100)After evaluating the setter, let’s resume the application and verify that the changes took effect. Yep – I see a full health bar!
Hook the expression
The only remaining step for reaching our goal is to automate the modification of the state so that the health refill happens behind the scenes, letting us enjoy the gameplay without interruptions.
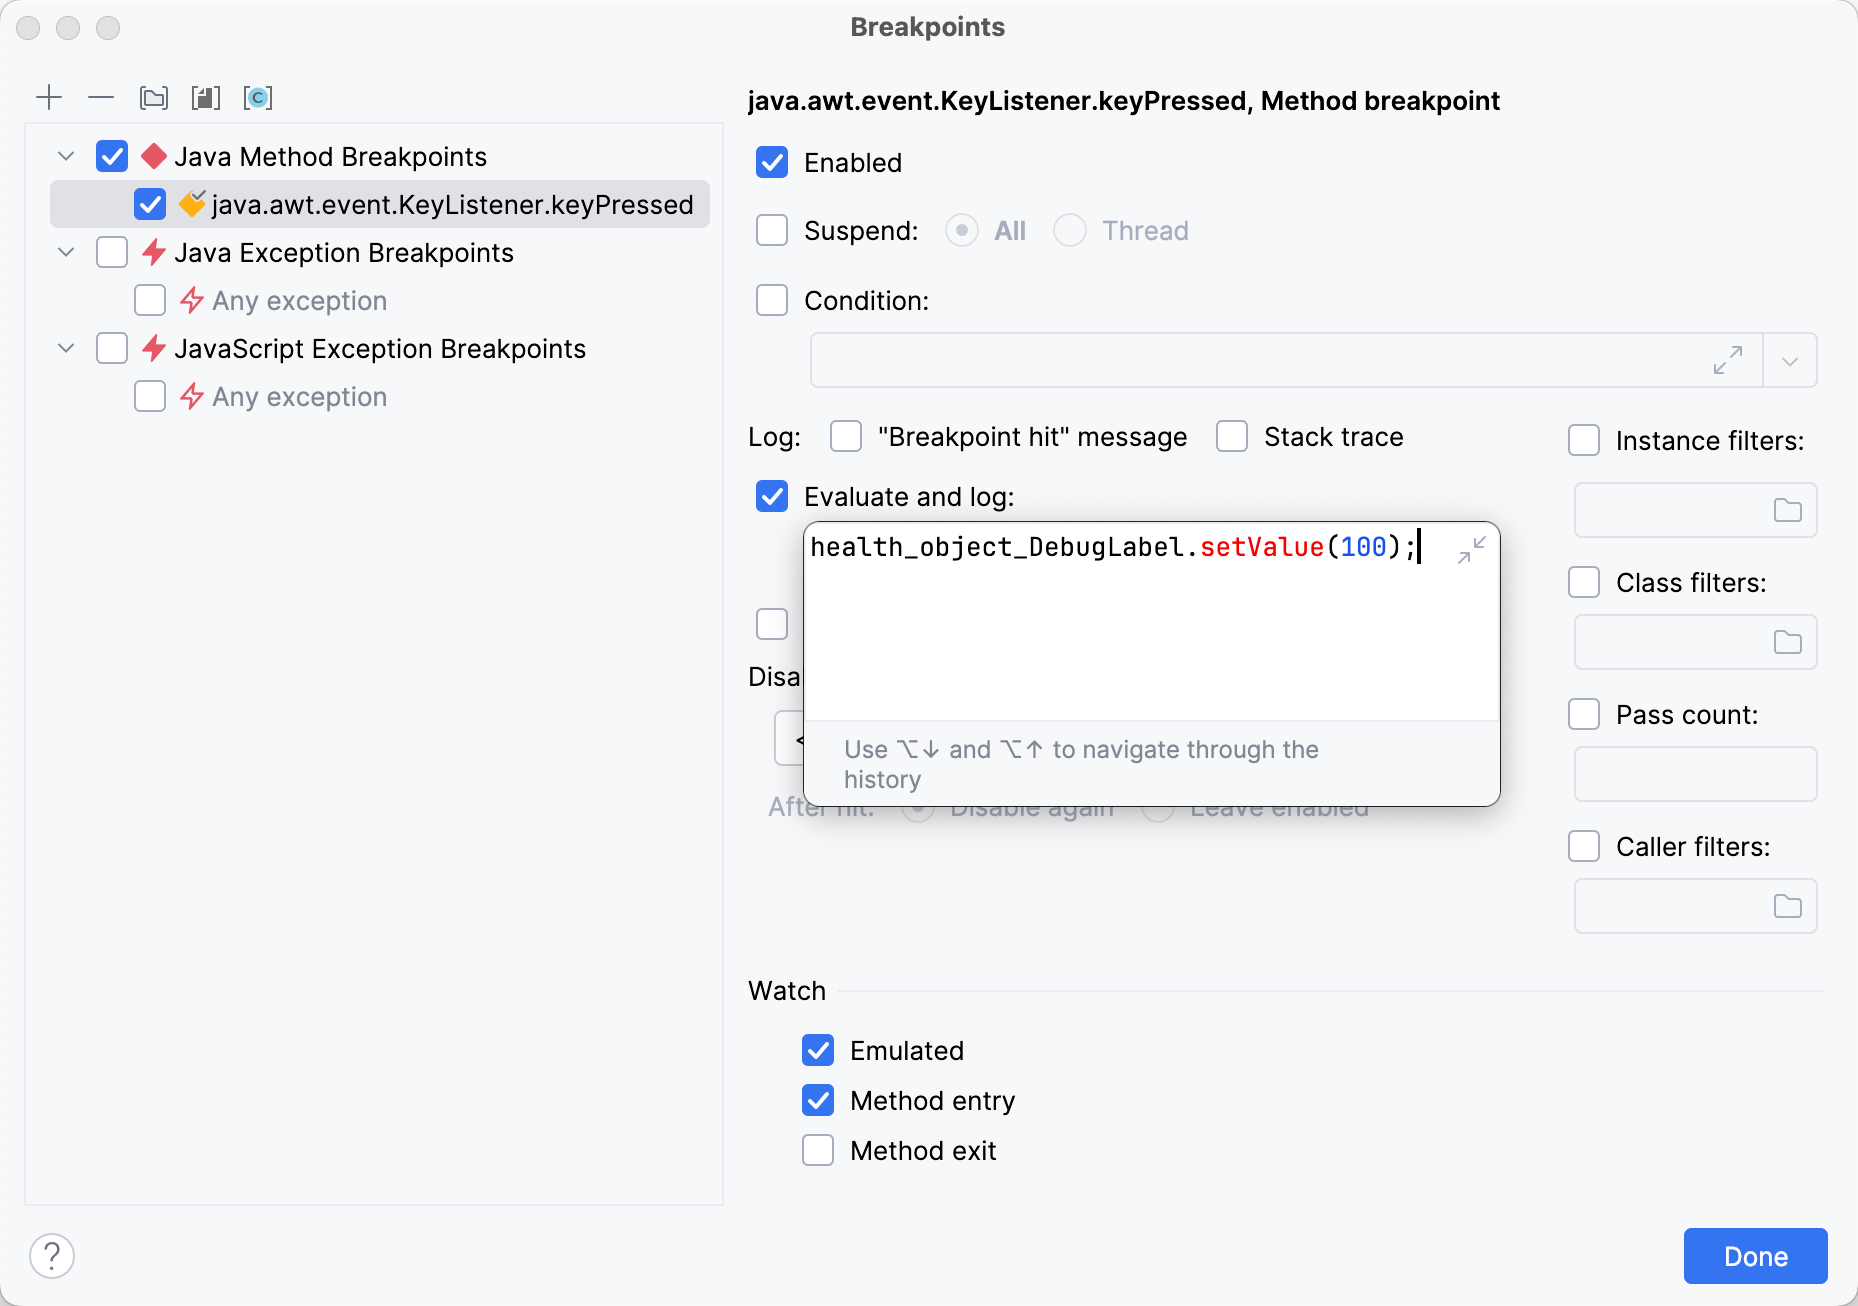
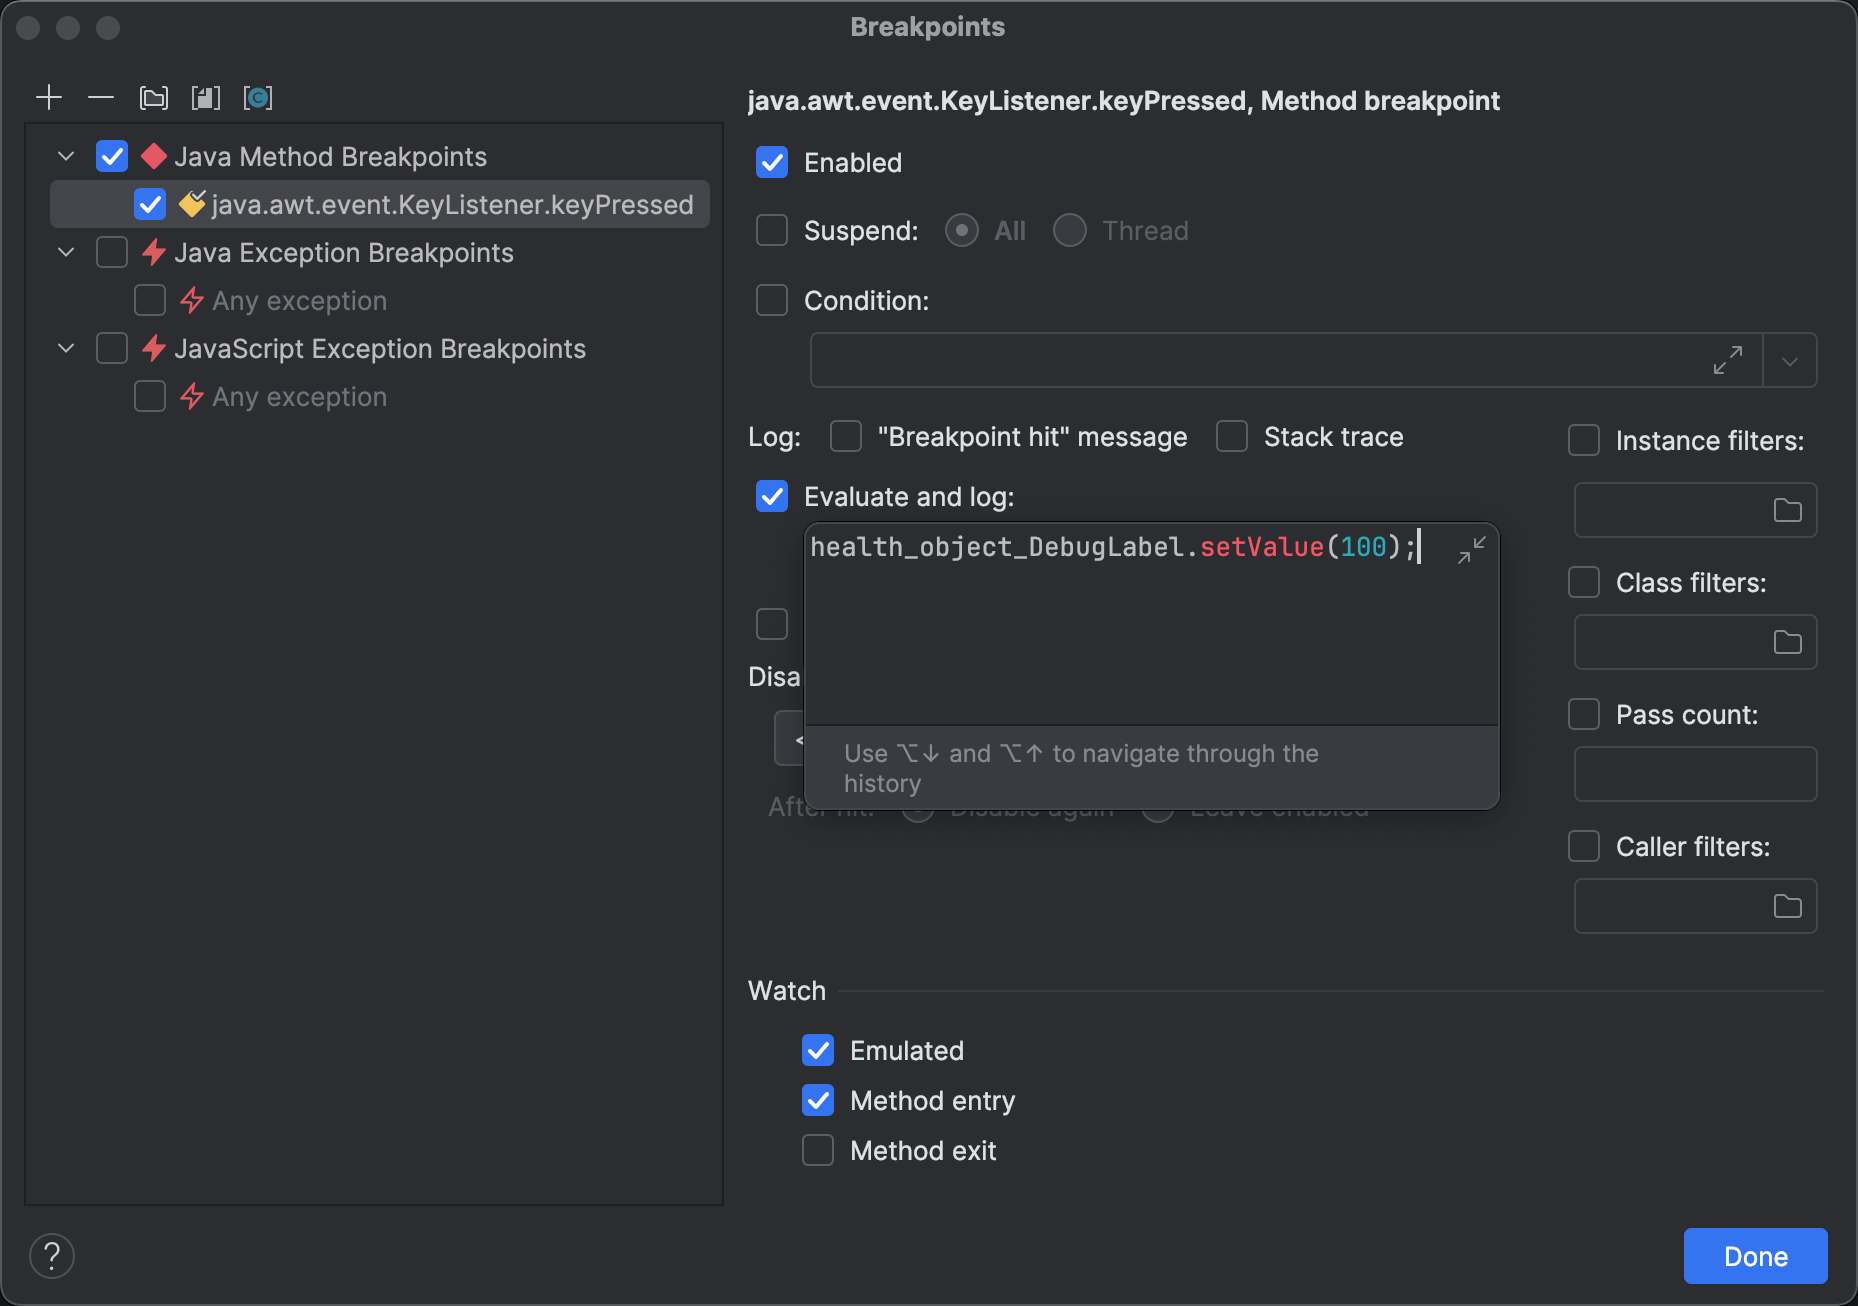
This can be done using non-suspending breakpoints. This type of breakpoint is commonly used for logging; however, the logging expression does not necessarily need to be pure. Therefore, we can introduce the desired side effect within the logging expression. But without the source code, it seems as though we don’t have anywhere to set this breakpoint.
Remember how I said that we might use the sources of the Java/Kotlin standard library? Here’s the idea: IntelliJ IDEA and its plugins are written in Java/Kotlin, and they use Swing as the UI framework. Consequently, Space Invaders is sure to call code from these dependencies. This means that we can use their sources to set breakpoints.
For the sake of simplicity, we didn’t specify a JDK version. Instead we initialized the project with the version suggested by IntelliJ IDEA. However, for best results, we recommend using sources that closely match the version used to run your program.
There are numerous locations suitable for setting a breakpoint.
I decided to set a method breakpoint in java.awt.event.KeyListener::keyPressed .
This will trigger the side effect every time we press a key:
Setting a breakpoint with an expression in hot code might significantly slow down the target application.
Let’s return to Space Invaders and see if our home-cooked IDDQD works. It does!
Conclusion
In this article, we used the debugger to find out how an application works under the hood. Then we were able to navigate through its memory and modify its functionality, all without touching the application’s sources! I hope my comparison of the debugger with IDDQD didn’t come across as too audacious, and that you learned some techniques that will give you a leg up in your debugging challenges.
I’d like to extend my kudos to Eugene Nizienko for making the Space Invaders plugin and Egor Ushakov for being a constant source of inspiration in debugging and programming. Computers are twice as fun with people like them around.
If you have debugging challenges in mind that you want me to tackle in the upcoming posts, let me know!
Happy hacking!