Better 'printf' Debugging
Other languages: Español Français Deutsch 日本語 한국어 Português 中文
One of the most common debugging techniques, ‘printf’ debugging is particularly popular because most people learn it intuitively when writing their first programs.
‘printf’ debugging is very accessible because you don’t need any special tools for it. When dealing with your first bugs, even before you know what a debugger is, it naturally comes to mind to make your program print variables step-by-step, so you can follow the execution in the console.
Even though it’s one of the most basic debugging techniques, experienced developers also use it a lot. It can help you investigate any type of issues, such as suboptimal routines, inconsistent state, multithreading issues, and more.
As I already mentioned, this technique doesn’t require you to use any special tools, such as an IDE. However, if you are using one, it can make you even more efficient in logging the program’s state.

This article shows features of IntelliJ IDEA. Similar features may or may not be available in other IDEs. If you are using a different tool, consider checking its documentation to see if these features are also present there.
Live templates
IntelliJ IDEA provides live templates for the most common debug logging patterns. To use a live template for debug logging, enter the corresponding shorthand and press Tab. IntelliJ IDEA will generate the print statement and insert it at the caret.
Let’s look at a couple of examples.
Log method parameters
public static BufferedImage recolor(BufferedImage in, BufferedImage mask, int newColor) {

    // type 'soutp' here, then press Tab

    return null;
}
public static BufferedImage recolor(BufferedImage in, BufferedImage mask, int newColor) {
System.out.println("in = " + in + ", mask = " + mask + ", newColor = " + newColor);
return null;
}Log values
public static double coolMethod(double parameter) {
    double a = Math.random();
    double b = Math.random();

    // type 'soutv' here, press Tab, then select the value

    return a * b * parameter;
}
public static double coolMethod(double parameter) {
double a = Math.random();
double b = Math.random();
System.out.println("b = " + b);
return a * b * parameter;
}Log method entries
public static BufferedImage recolor(BufferedImage in, BufferedImage mask, int newColor) {

    // type 'soutm' here, then press Tab

    return null;
}
public static BufferedImage recolor(BufferedImage in, BufferedImage mask, int newColor) {
System.out.println("ImageUtils.recolor");
return null;
}Logging breakpoints
One of the downsides of debugging with print statements is that they introduce the overhead of manual management. You cannot quickly turn them on and off, and you definitely don’t want to accidentally commit and run them in production.
For this reason, if you need to log something for debugging purposes, I’d recommend using logging breakpoints, since they are much easier to manage.
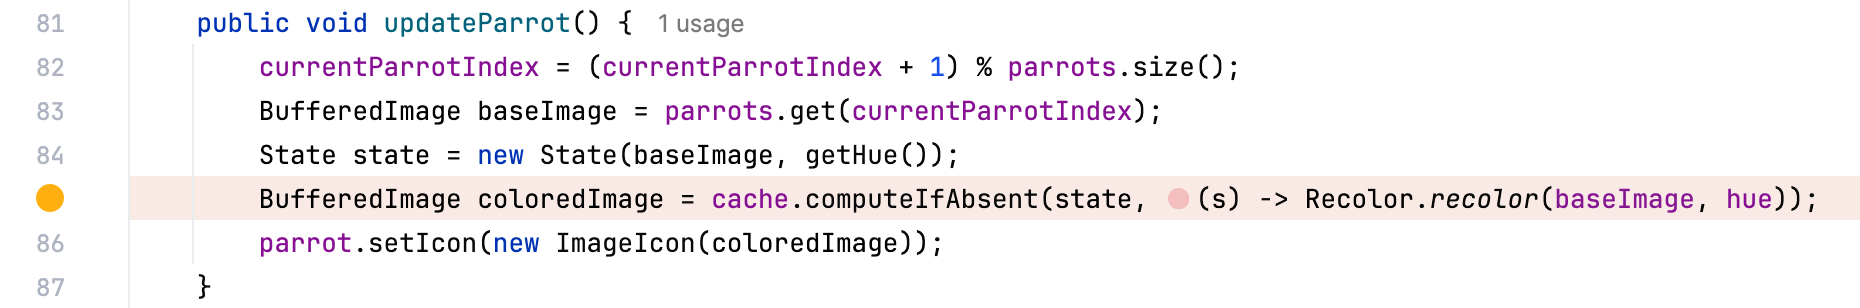
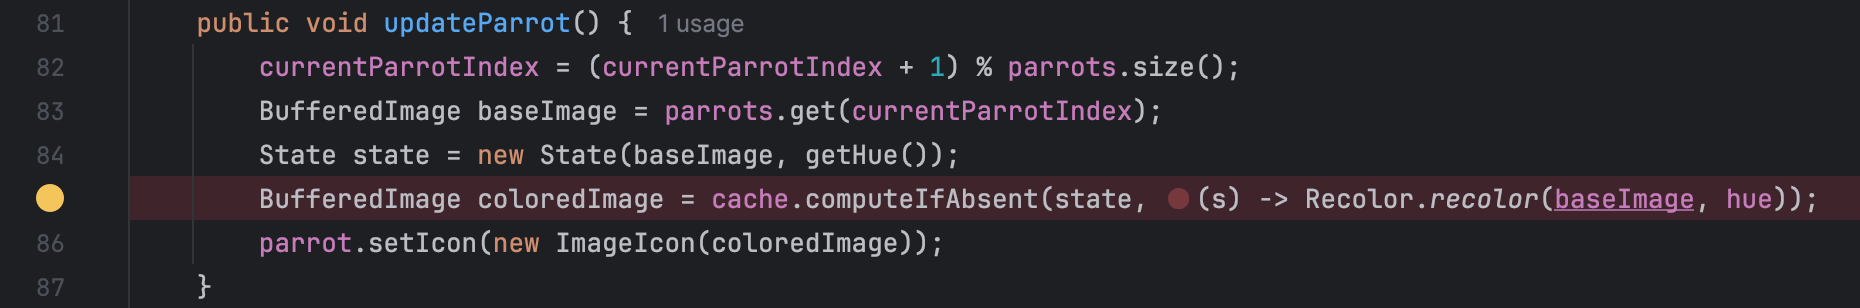
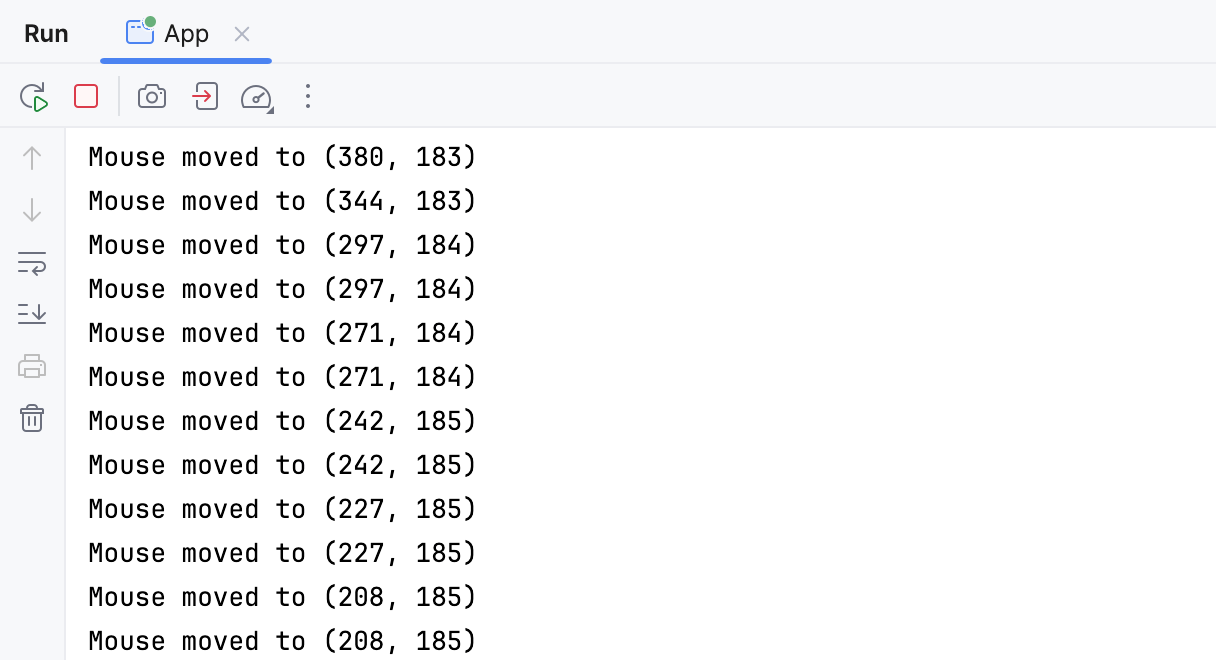
To set a logging breakpoint, hold Shift, then click the gutter. Unlike a regular breakpoint, it doesn’t suspend the program’s execution, but prints to console instead.
By default, it is a message stating that the program reached this line. You can also use the options near the Evaluate and log checkbox in the breakpoint’s settings if you prefer to log the current stack trace or the result of a custom expression.
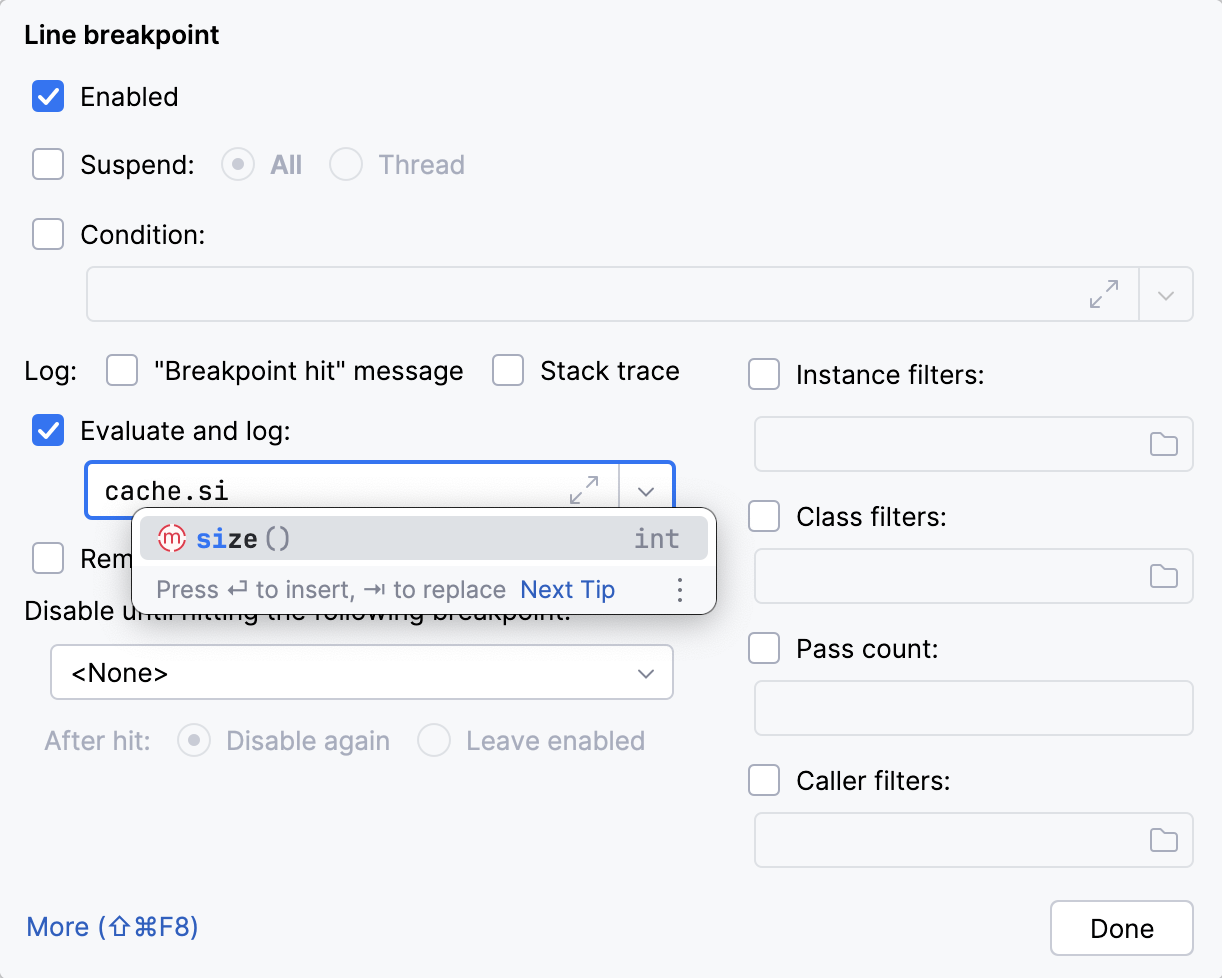
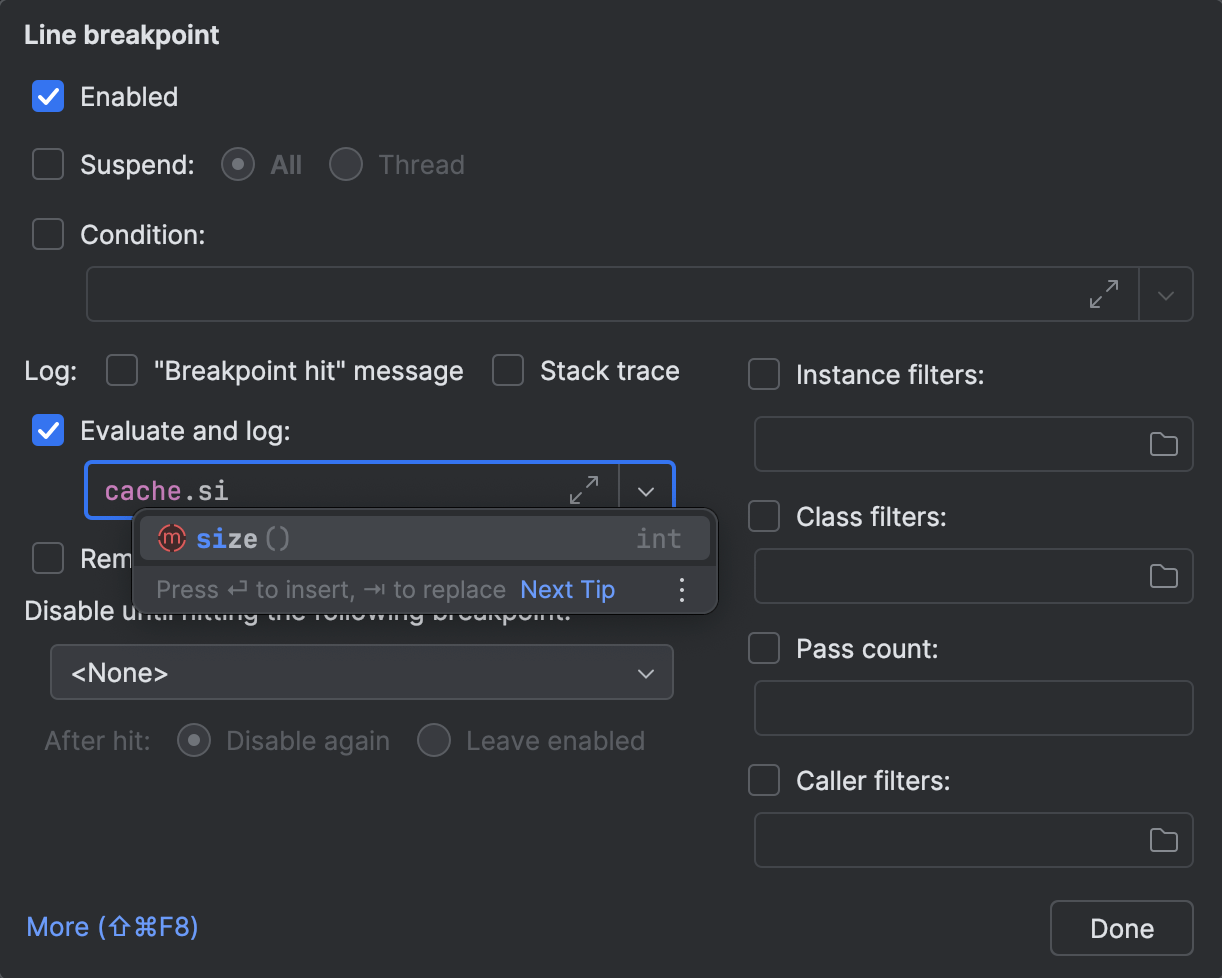
Be careful with logging expressions. Evaluating those that cause side effects can be a source of new bugs or unexpected behavior. Also, when used in hot code, they might significantly slow down your program.
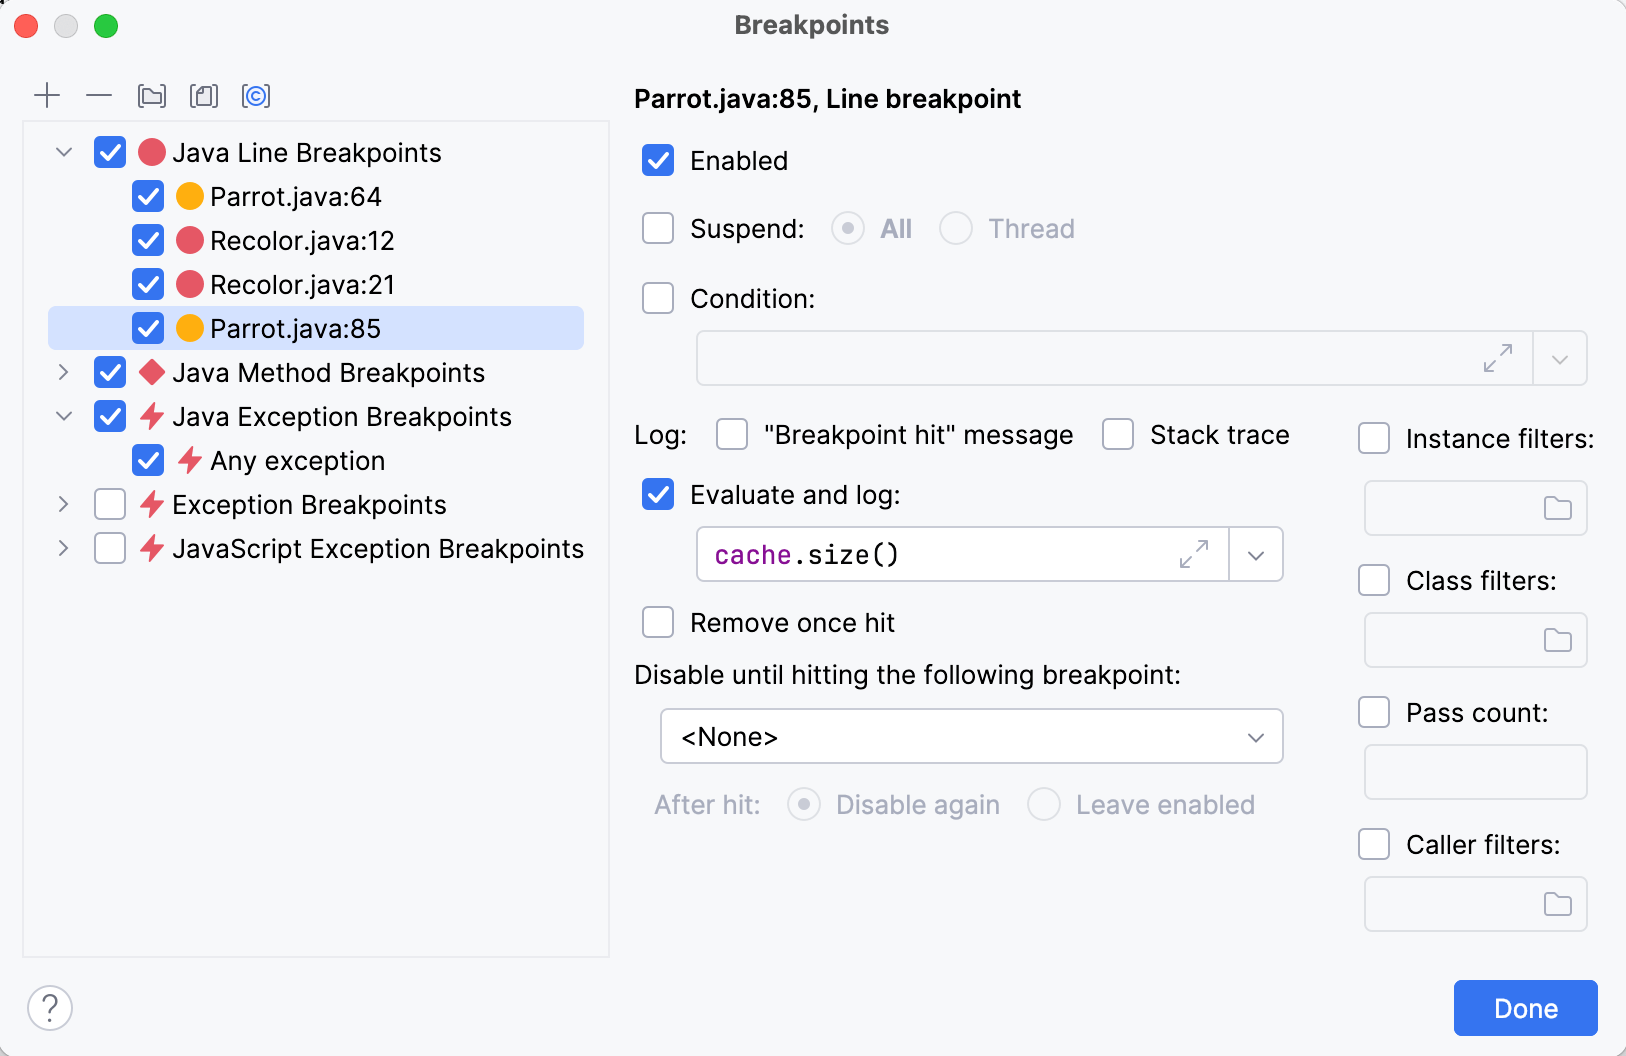
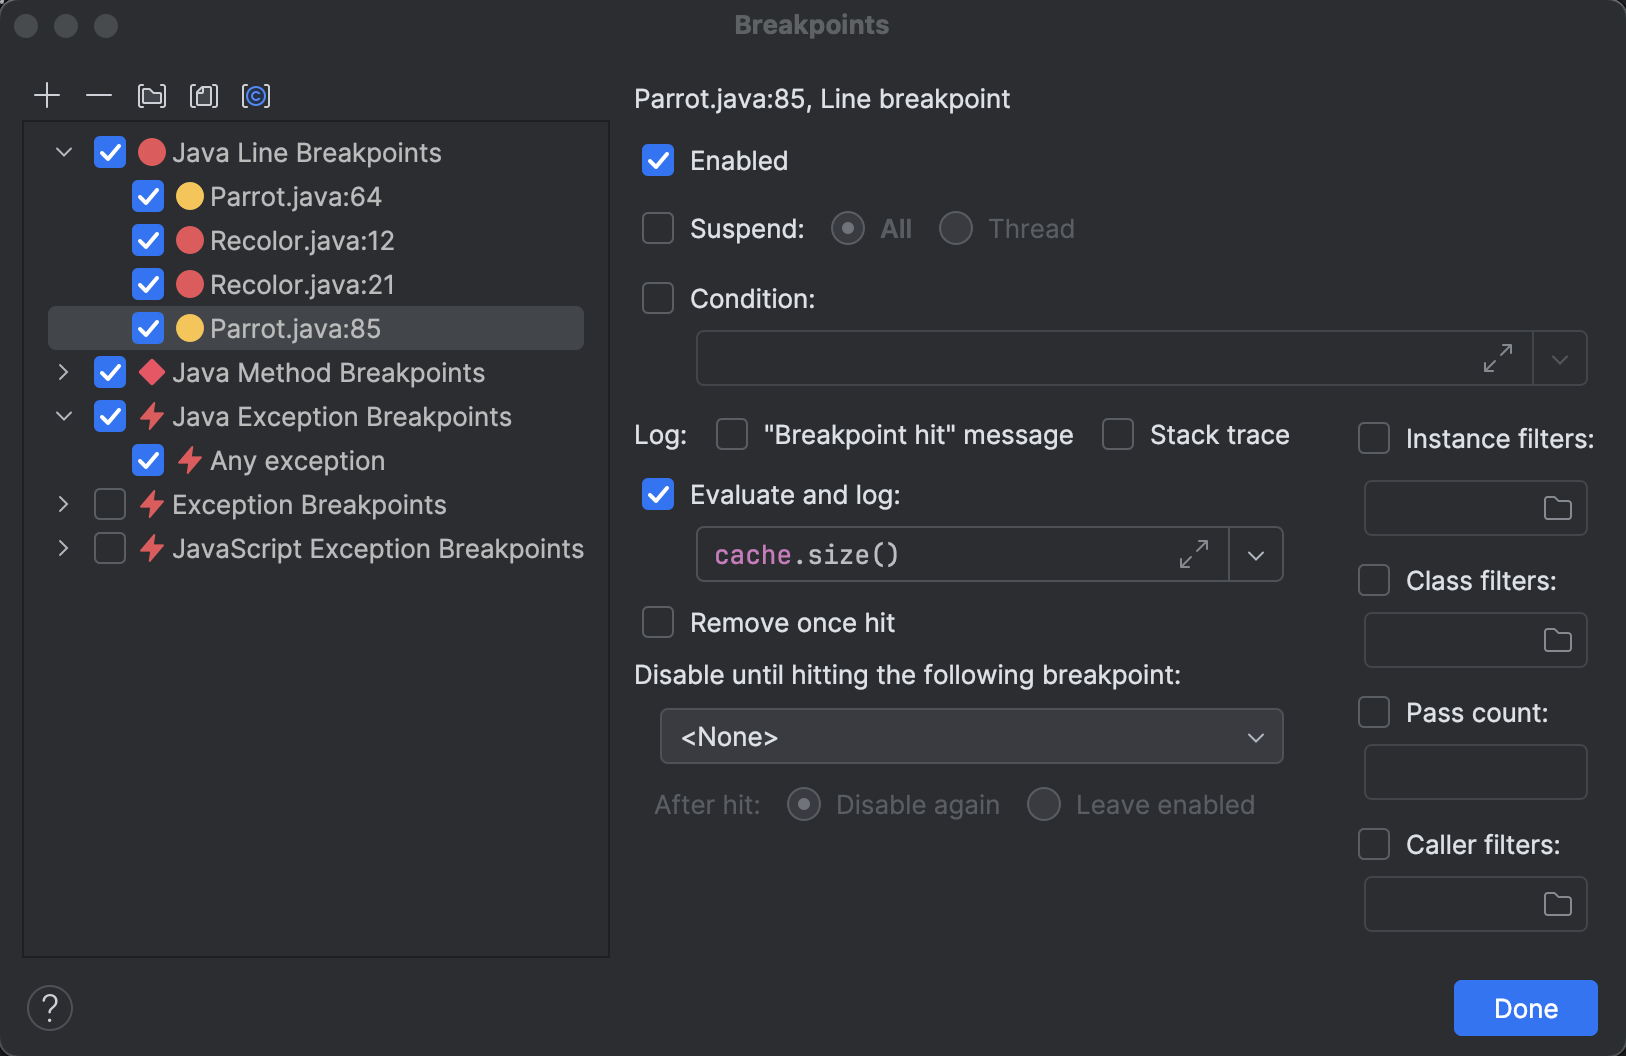
When logging breakpoints become numerous, you can keep track and manage them in the Breakpoints dialog (Run | View Breakpoints):
You can even create custom groups for them:
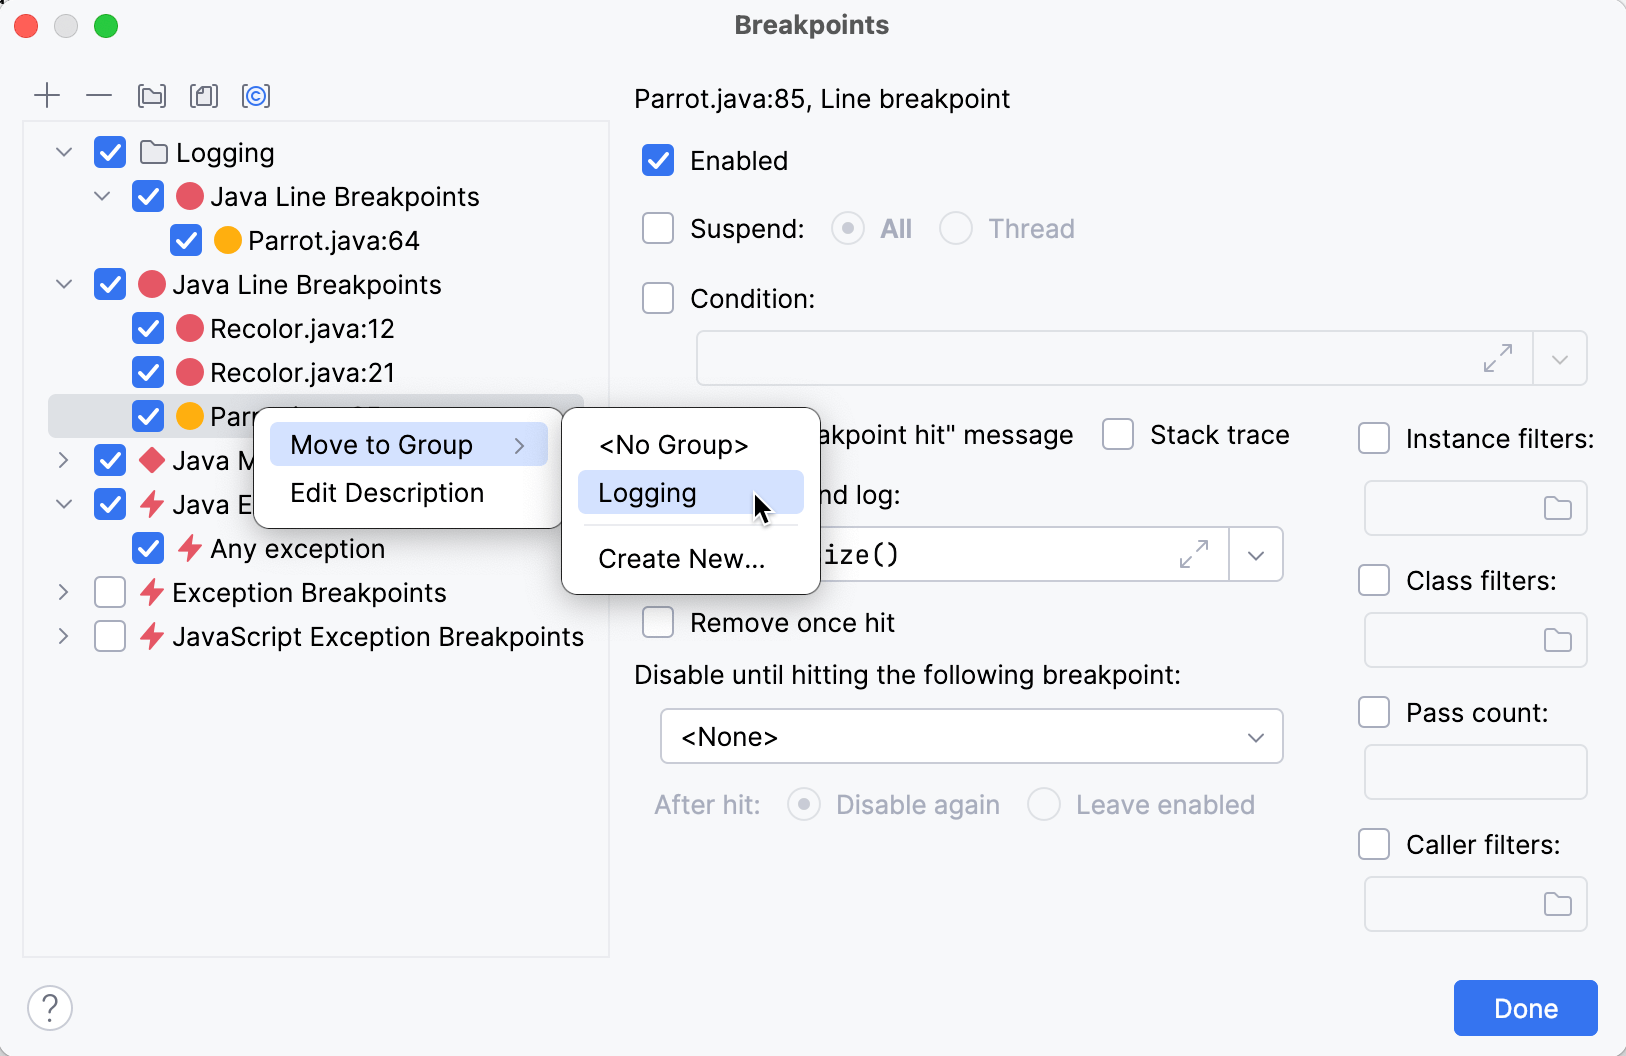
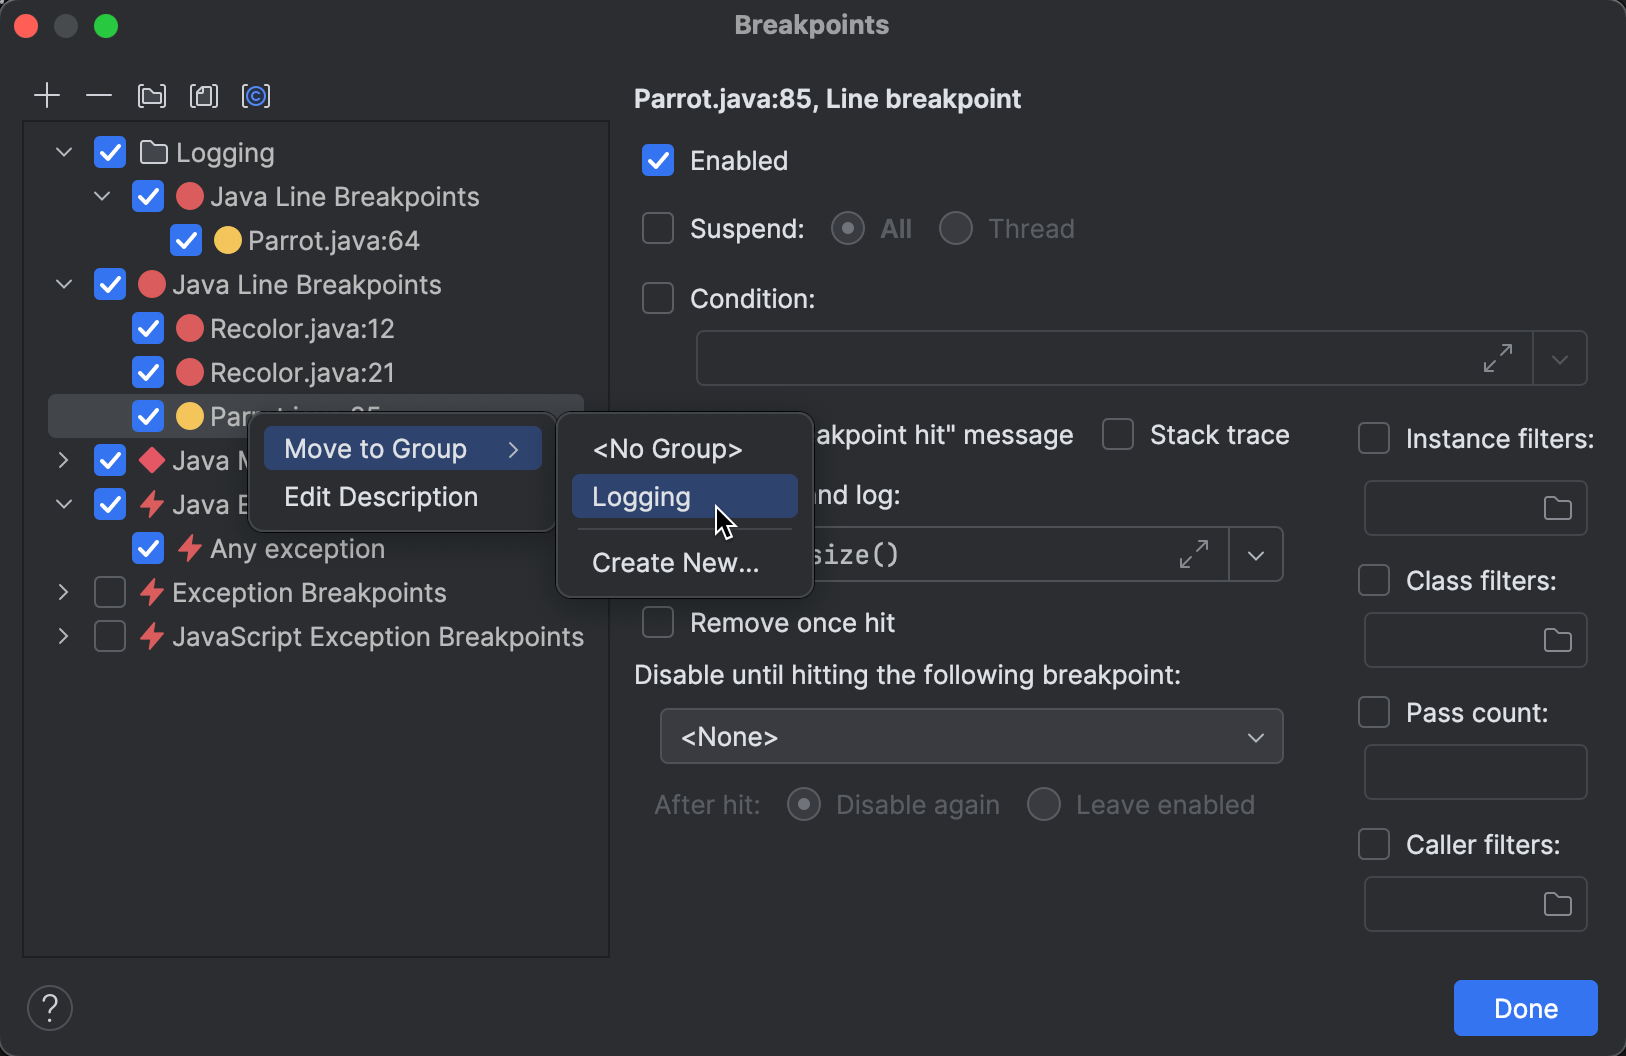
This will help you manage your breakpoints in a centralized manner. For example, you can create a group related to a particular bug and save it for later. When the problem goes away, just turn it off. This way, should the problem appear again, you don’t have to recreate everything from scratch. You just turn the group on again.
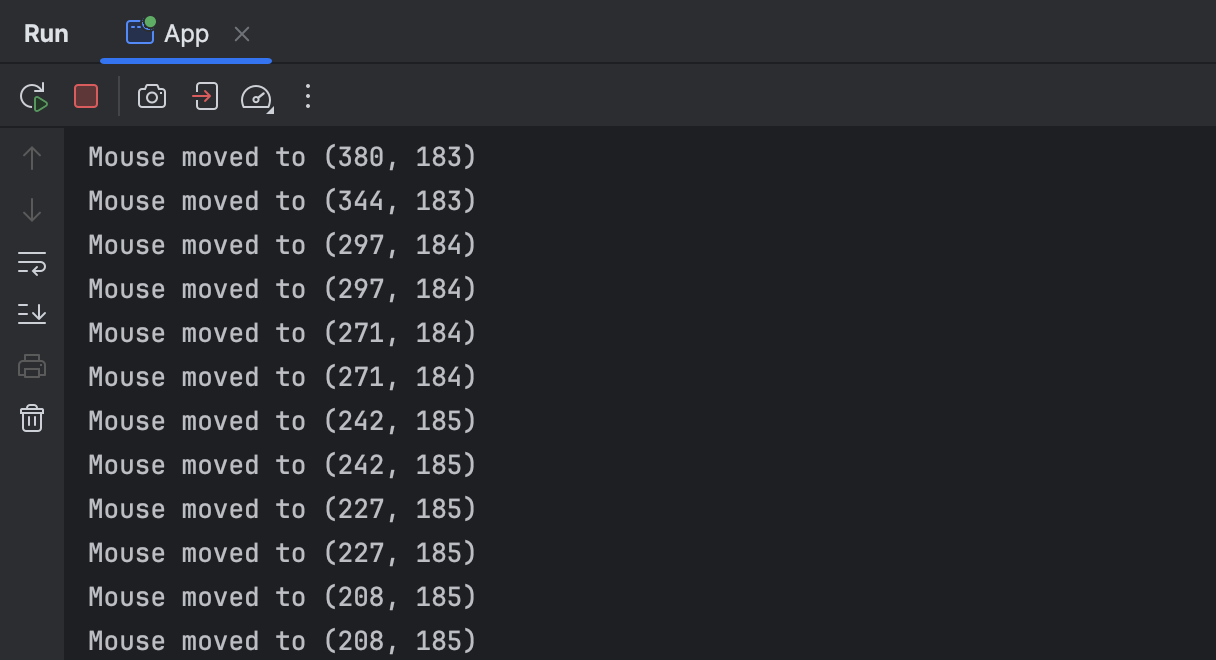
Logging frequent events
For events that happen a lot during the program execution, logging every single event may be superfluous. Not only does this flood the console with messages, but a lot of interaction with I/O can significantly slow down the debugging session.
For such events, it may be useful to use the Pass count feature. You can access it in the Breakpoints dialog.
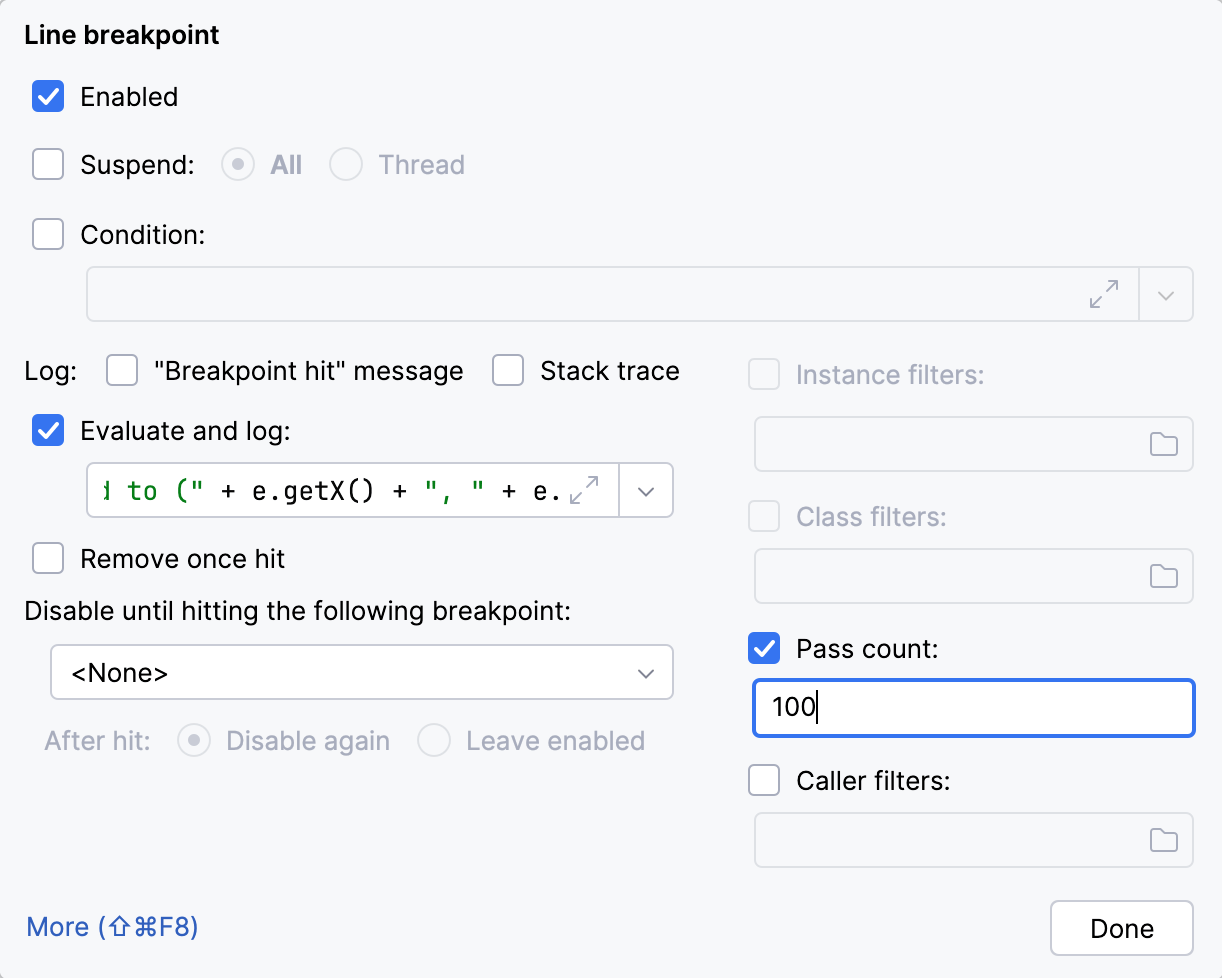
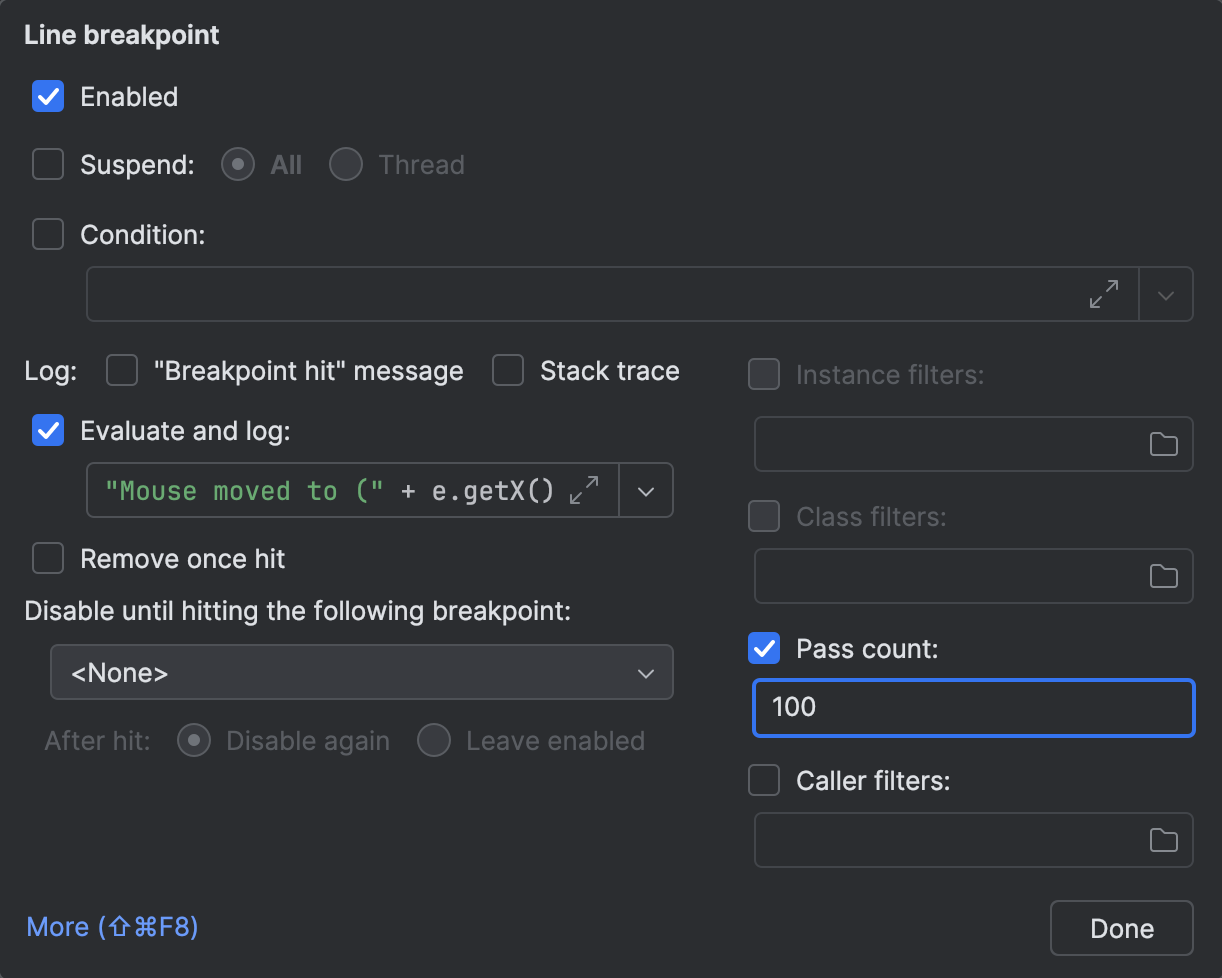
After you have set Pass count to a specific value, the corresponding breakpoint will only fire each n-th hit, ensuring that logging does not become a nuisance.
Summary
Regardless of whether you are inserting print statements or setting logging breakpoints for debugging, modern tools have features to improve your debugging experience. With this post, I wanted to make sure you are aware of these little tricks that make the entire process more enjoyable.
Happy debugging!