Self-profiling IntelliJ IDEA
Other languages: Español Français Deutsch 日本語 한국어 Português 中文
Just like the previous post, this one is going to be slightly meta. Obviously, you can use IntelliJ IDEA to profile another process, but did you know IntelliJ IDEA can profile itself?

This might be useful if you are writing an IntelliJ IDEA plugin and need to address issues related to the plugin’s performance. Also, regardless of whether you are a plugin author, this scenario might be interesting to you because the profiling strategy that I’ll cover is not exclusive to IntelliJ IDEA – you can use it to troubleshoot similar bottlenecks in other types of projects and using other tools.
The problem
In this post, we’ll look at a rather interesting performance bottleneck I stumbled upon a couple of years ago.
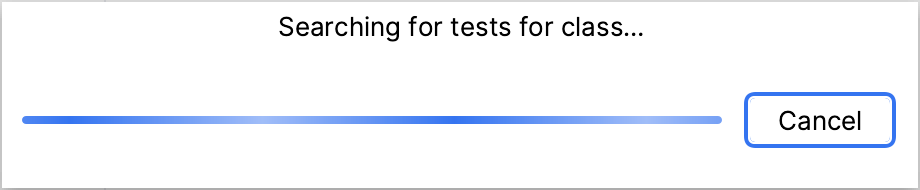
While working on a side project in IntelliJ IDEA, I noticed that
finding tests (Navigate | Test) for classes with certain short names, such as A ,
was surprisingly slow, often taking 2 minutes or longer.
The presence of the bottleneck didn’t seem to depend on the size of the project –
even in projects consisting of a single class named A ,
the navigation would still take very long.
I have never experienced delays related to this feature even in the huge
IntelliJ IDEA monorepo, so the slowdown in an almost empty project seemed especially curious.
Why was this happening? And, more importantly, how to approach similar issues, should you encounter them in your project?
Recreate the environment
I originally wrote this article for internal use at JetBrains, however, the idea to make it public came to me only recently. Fortunately, as the time passed, the article hasn’t aged well, and the problem seems no longer reproducible on the current versions of IntelliJ IDEA and more recent hardware.
As I couldn’t reproduce the slowdown on my working setup, I found myself dusting off my old laptop and installing an earlier version of IntelliJ IDEA on it. If you want to follow the investigation in your IDE, make sure to clone the IntelliJ IDEA Community Edition repo, as this will ease navigation and debugging for you.
Let’s also make sure we have an empty project with the following class in it:
public class A {
    public static void main(String[] args) {
        System.out.println("I like tests");
    }
}
IntelliJ Profiler
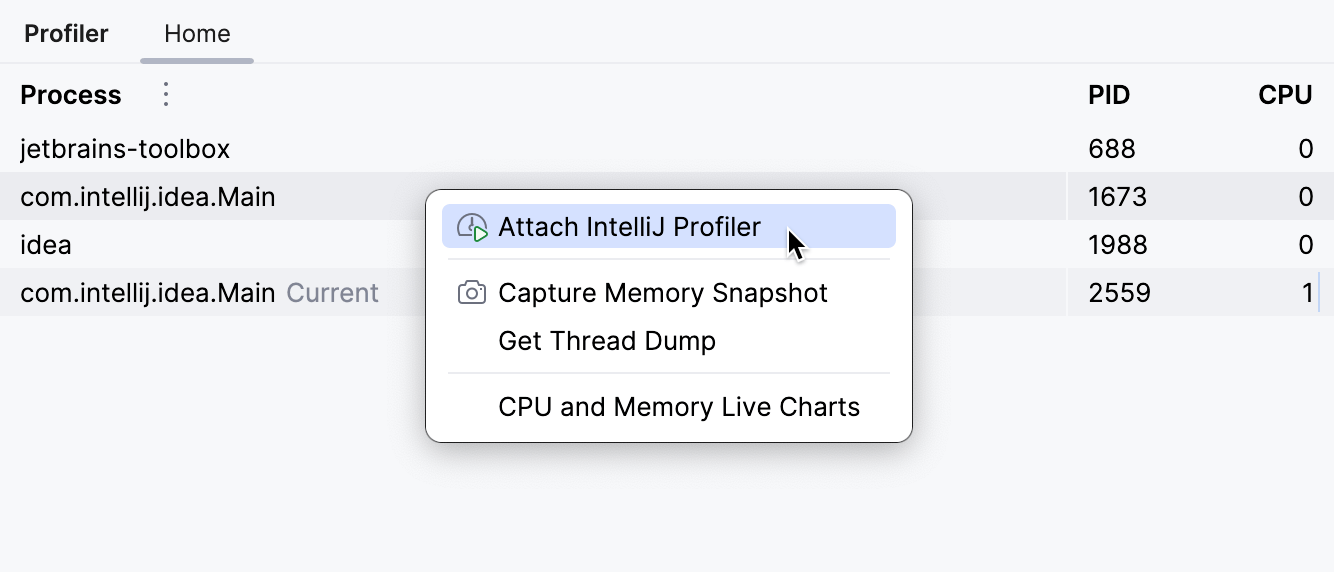
As you already know, IntelliJ IDEA has an integrated JVM profiler. You can launch applications with the profiler attached. Alternatively, you can attach the profiler to an already running process, which is what we are going to do.
For this, go to the Profiler tool window and find the corresponding process there. If you don’t see your IDE in the list, make sure to check Show Development Tools in the menu near Process. When you click a process, IntelliJ IDEA suggests the integrated performance analysis tools, which allow you to:
- profile CPU usage and memory allocations
- analyze JVM heap
- capture thread dumps
- monitor real-time resource consumption
All these tools are covered in the documentation, and in this post we will focus specifically on the profiler.
We need to attach the profiler before the problem happens. For example, if the problem arises as the result of calling some API, attach the profiler to the process first, then reproduce the events that cause the problem.

Ideally, we should attach the profiler right before reproducing the problem. If your application is busy doing something else rather than just waiting for input, this approach will help you minimize the number of irrelevant samples.
Depending on how long the problematic code takes to execute, it may also make sense to reproduce the problem several times, so that the profiler could collect more samples for analysis. This will make the problem stand out more in the resulting report.
When you detach the profiler or terminate the process, IntelliJ IDEA automatically opens the resulting snapshot.
Analyzing the report
To analyze the snapshots, you have several views at your disposal. You can choose to examine call trees, stats for particular methods, CPU load per thread, GC activity, and more.
For the problem at hand, let’s start with the Timeline view to see if we can spot anything unusual:
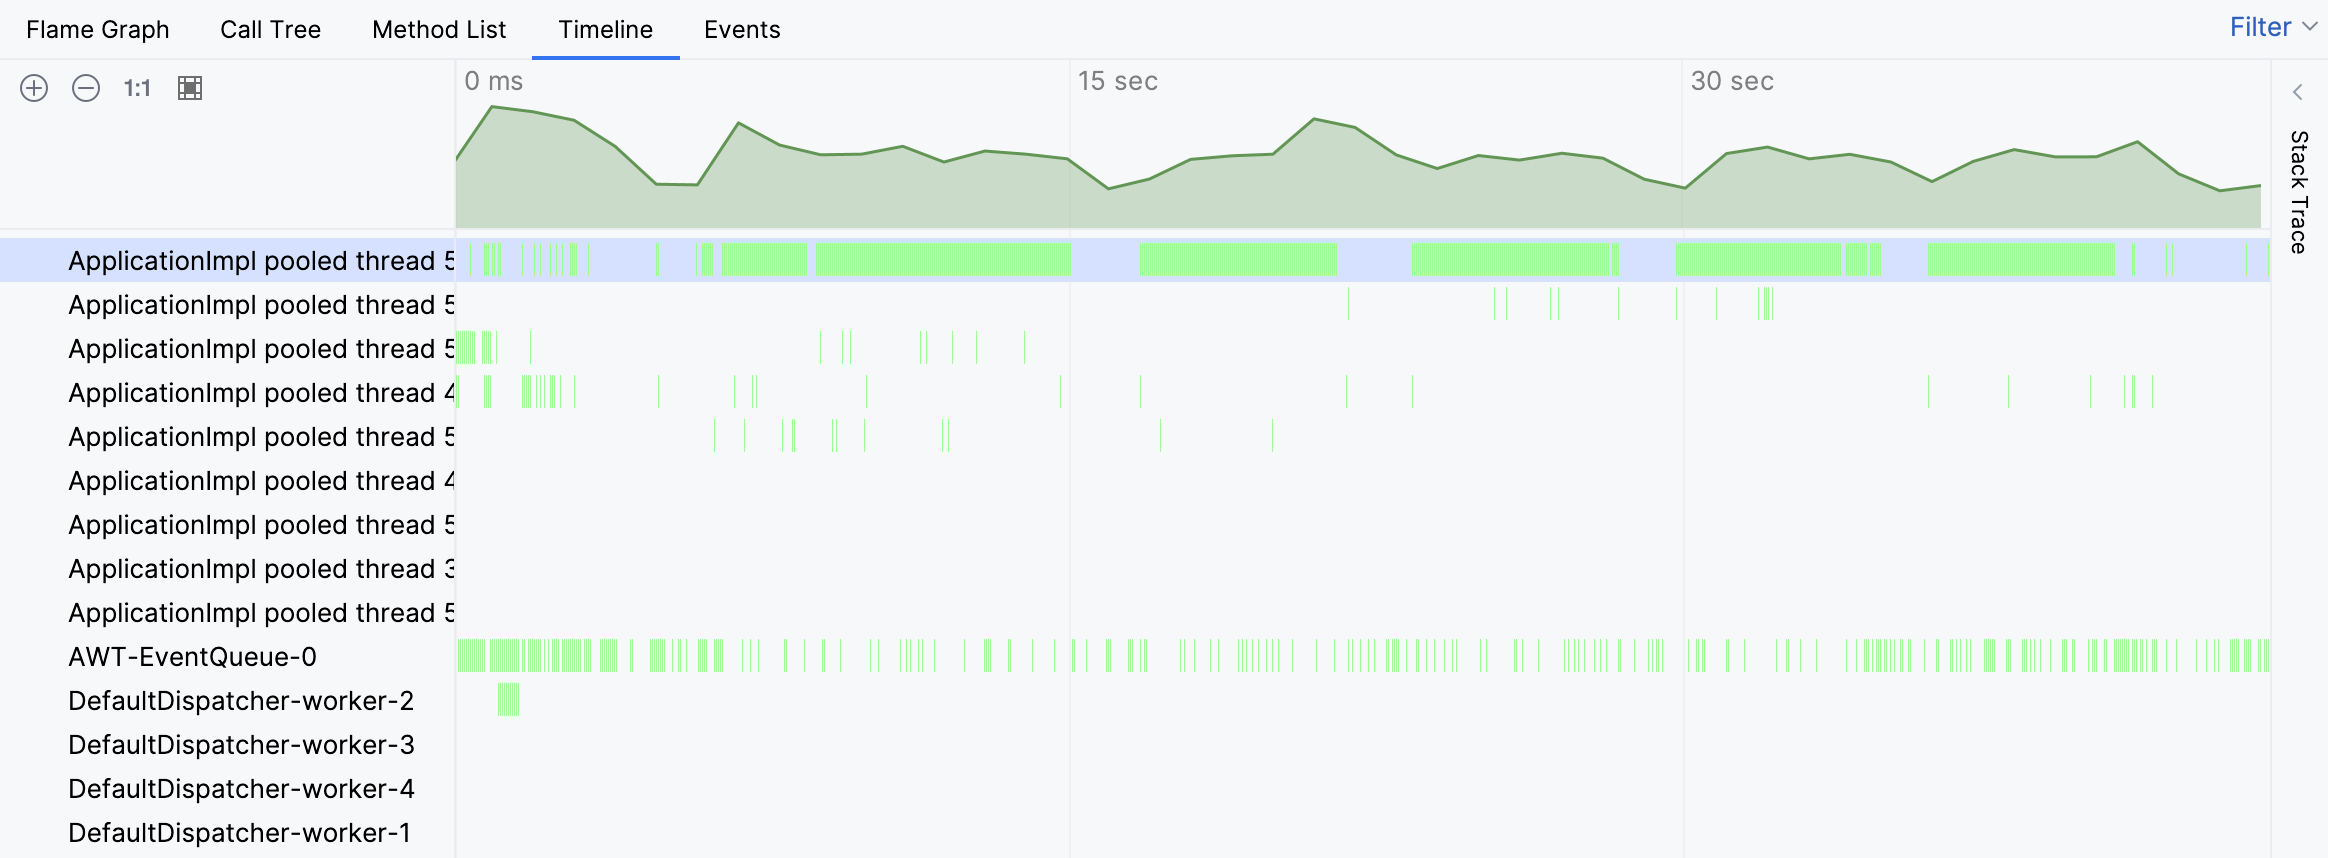
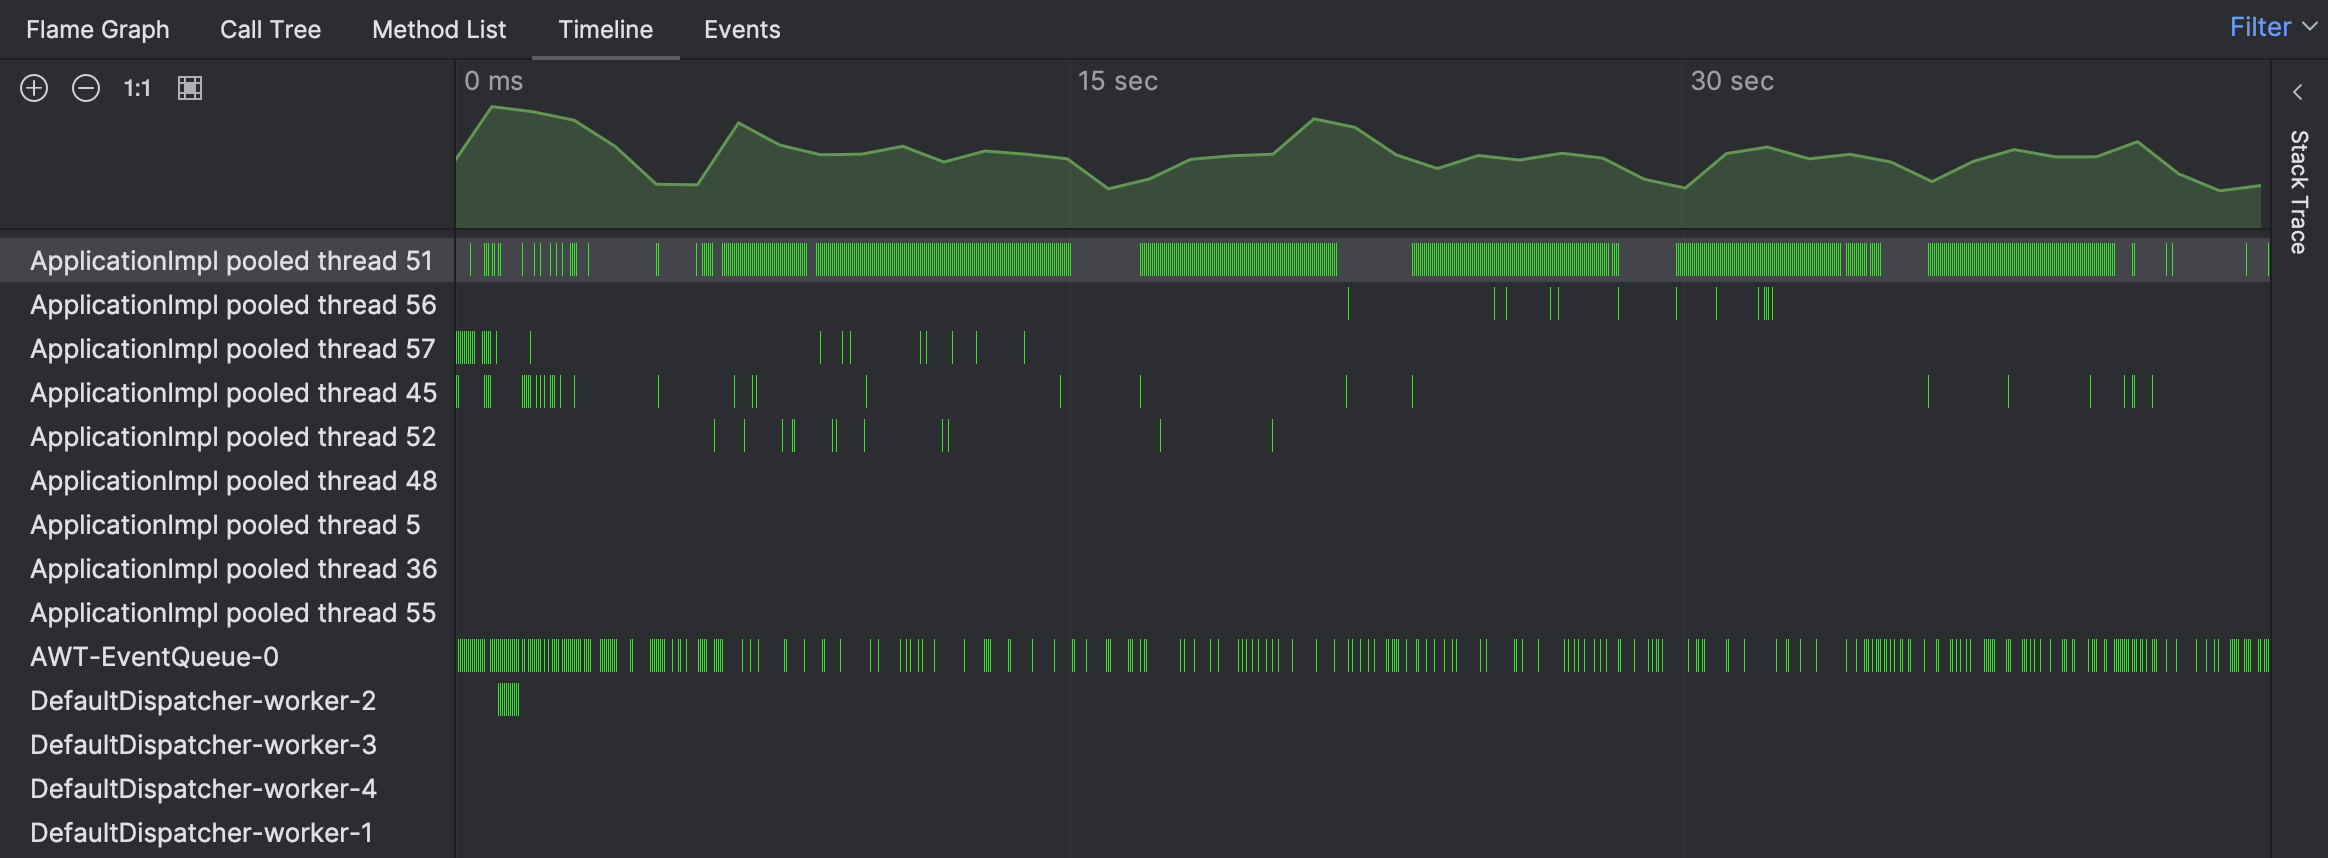
Indeed, the timeline indicates that one of the threads was extraordinarily busy. The green bars correspond to the samples collected for a particular thread. By clicking any of these bars, we can see the corresponding stack trace for the sample.
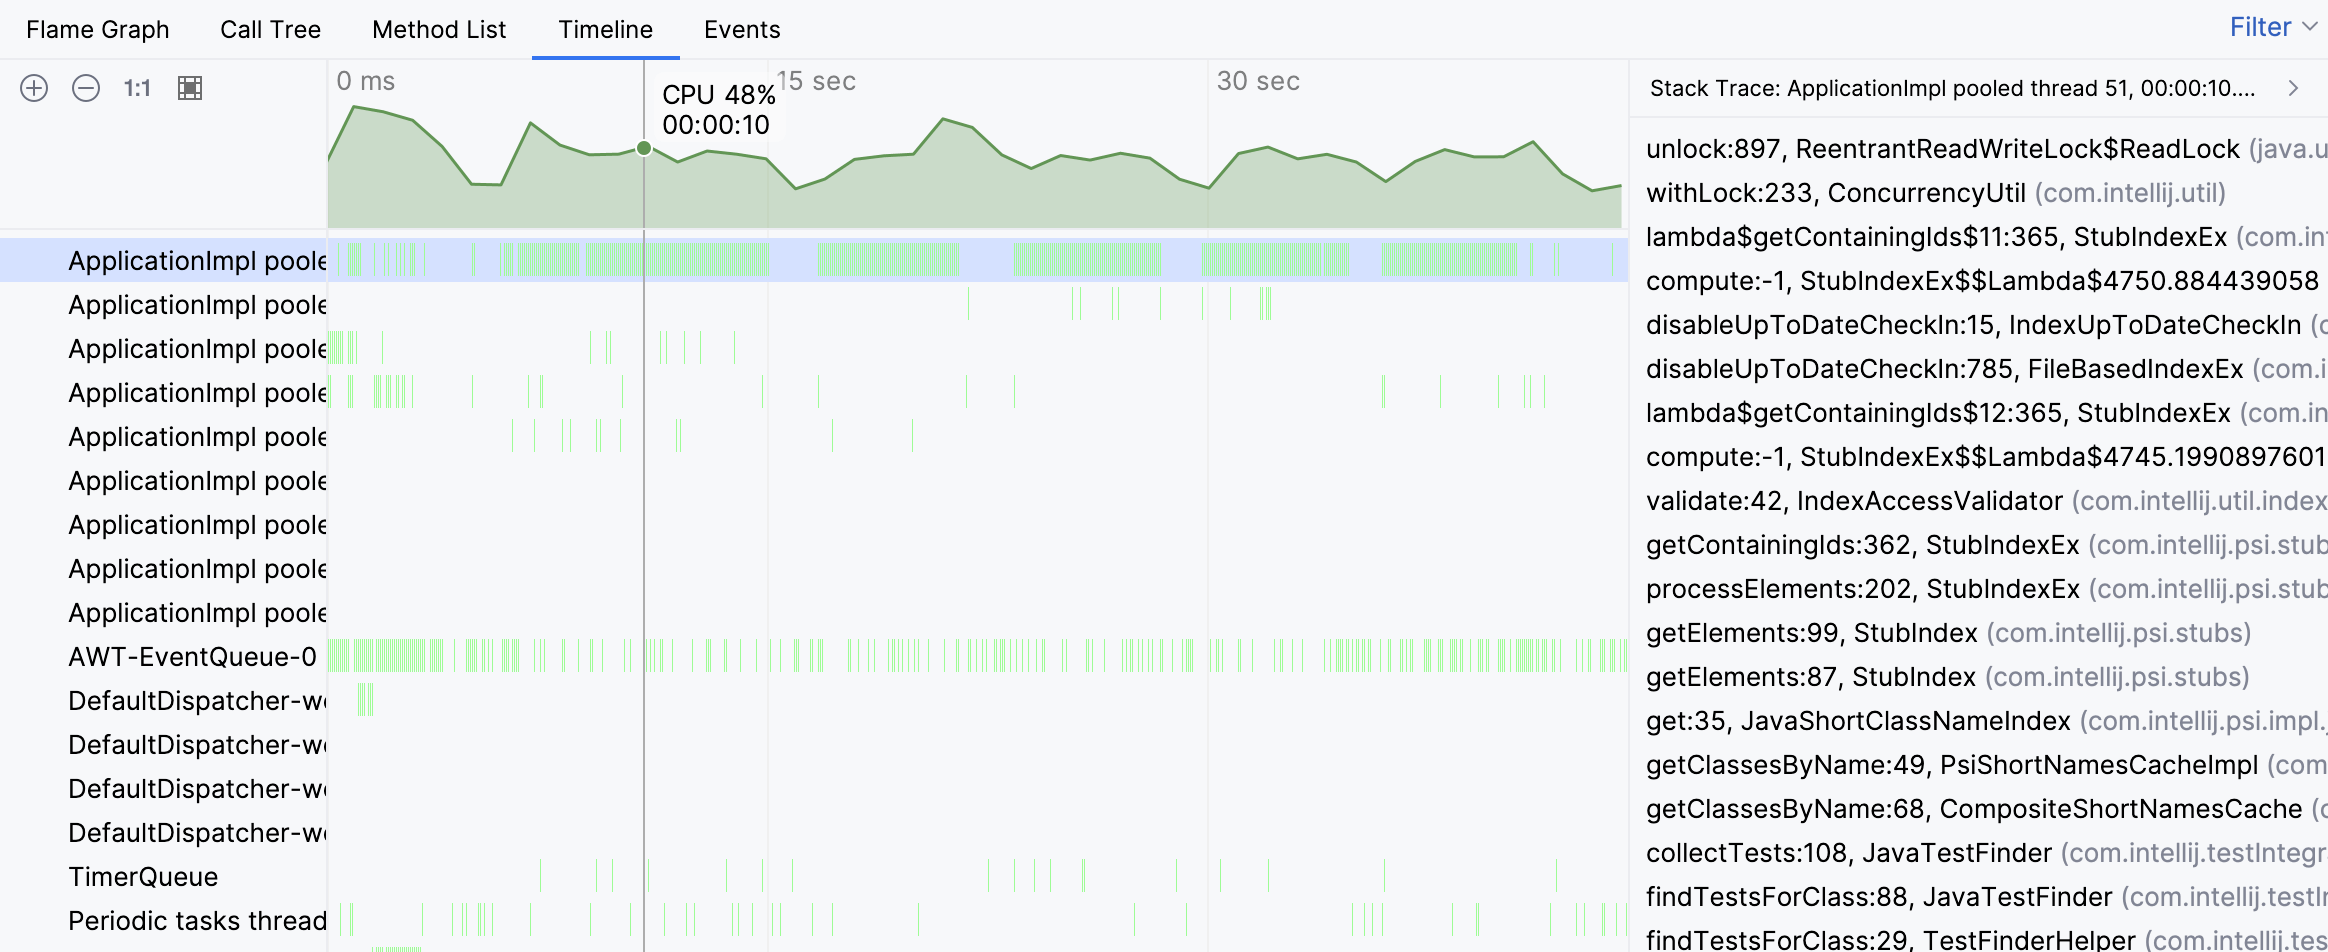
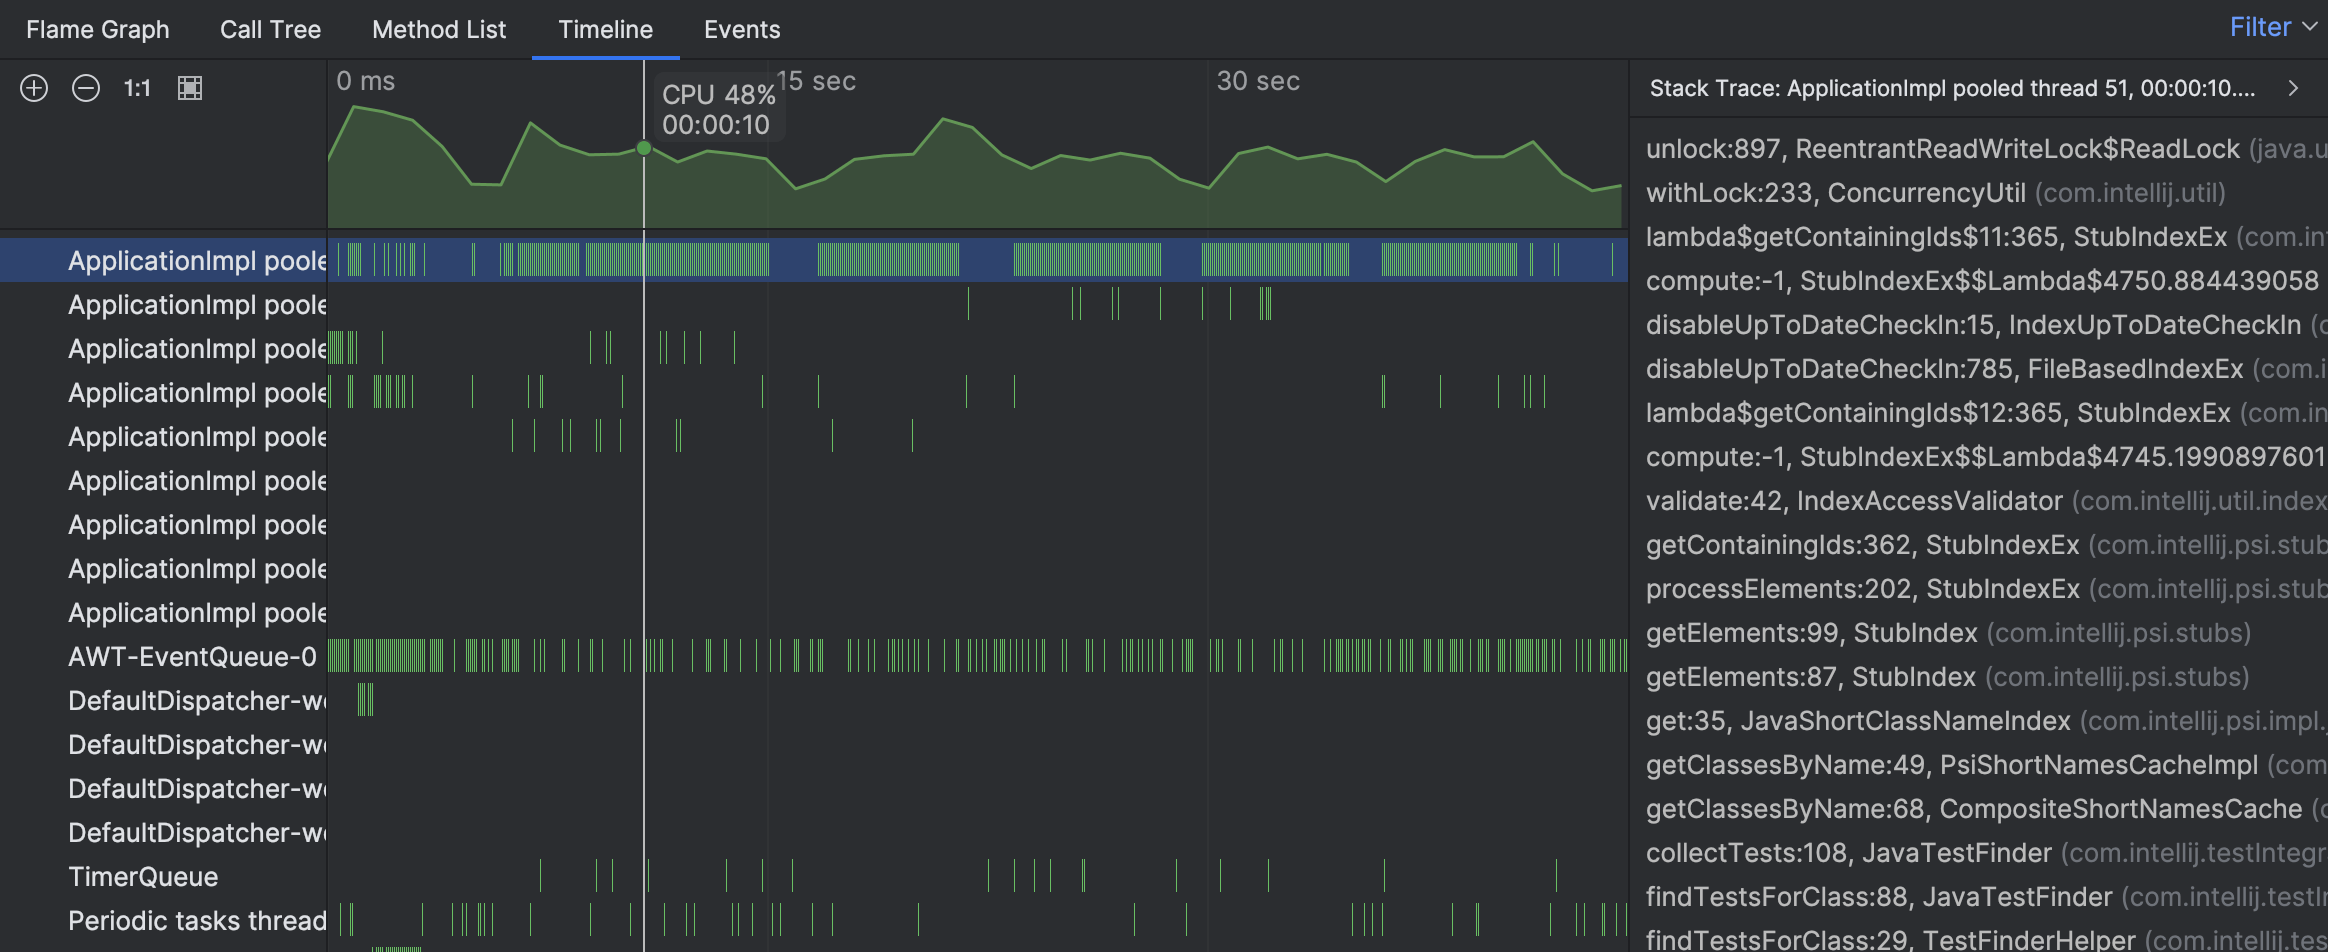
The stack traces from individual samples suggest that the thread’s activity is associated with finding tests. However, we still don’t see the big picture. Let’s navigate to the busy thread on the flame graph:
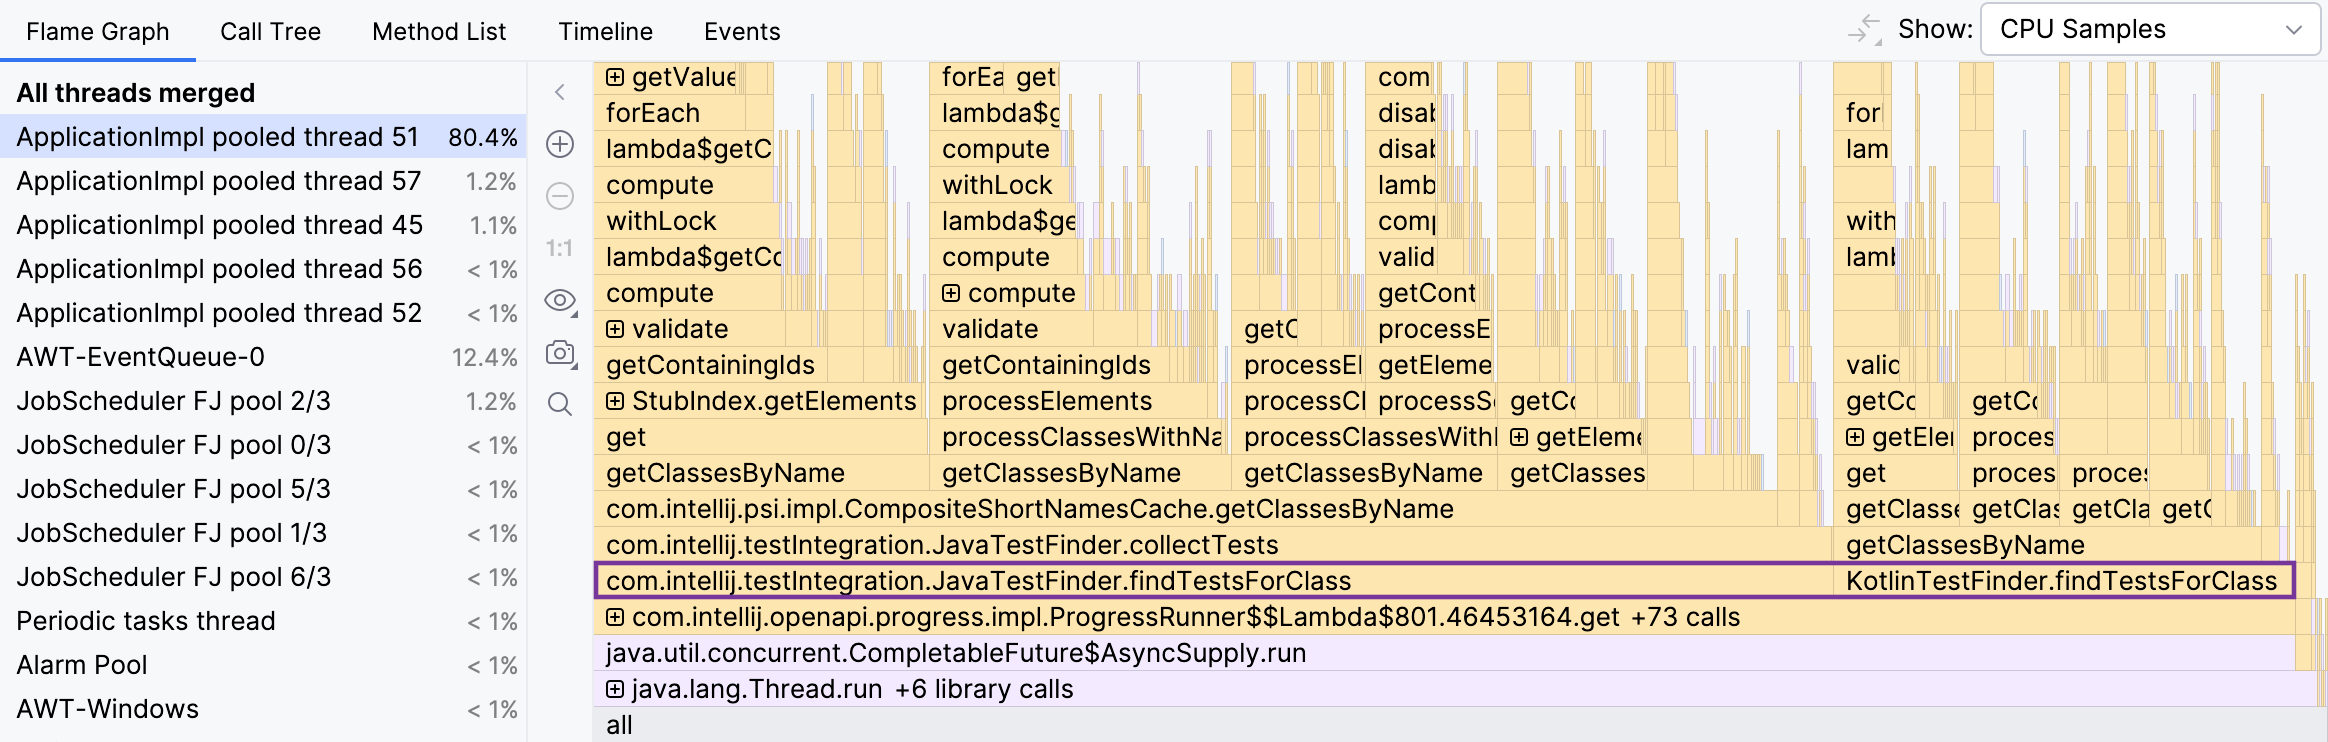
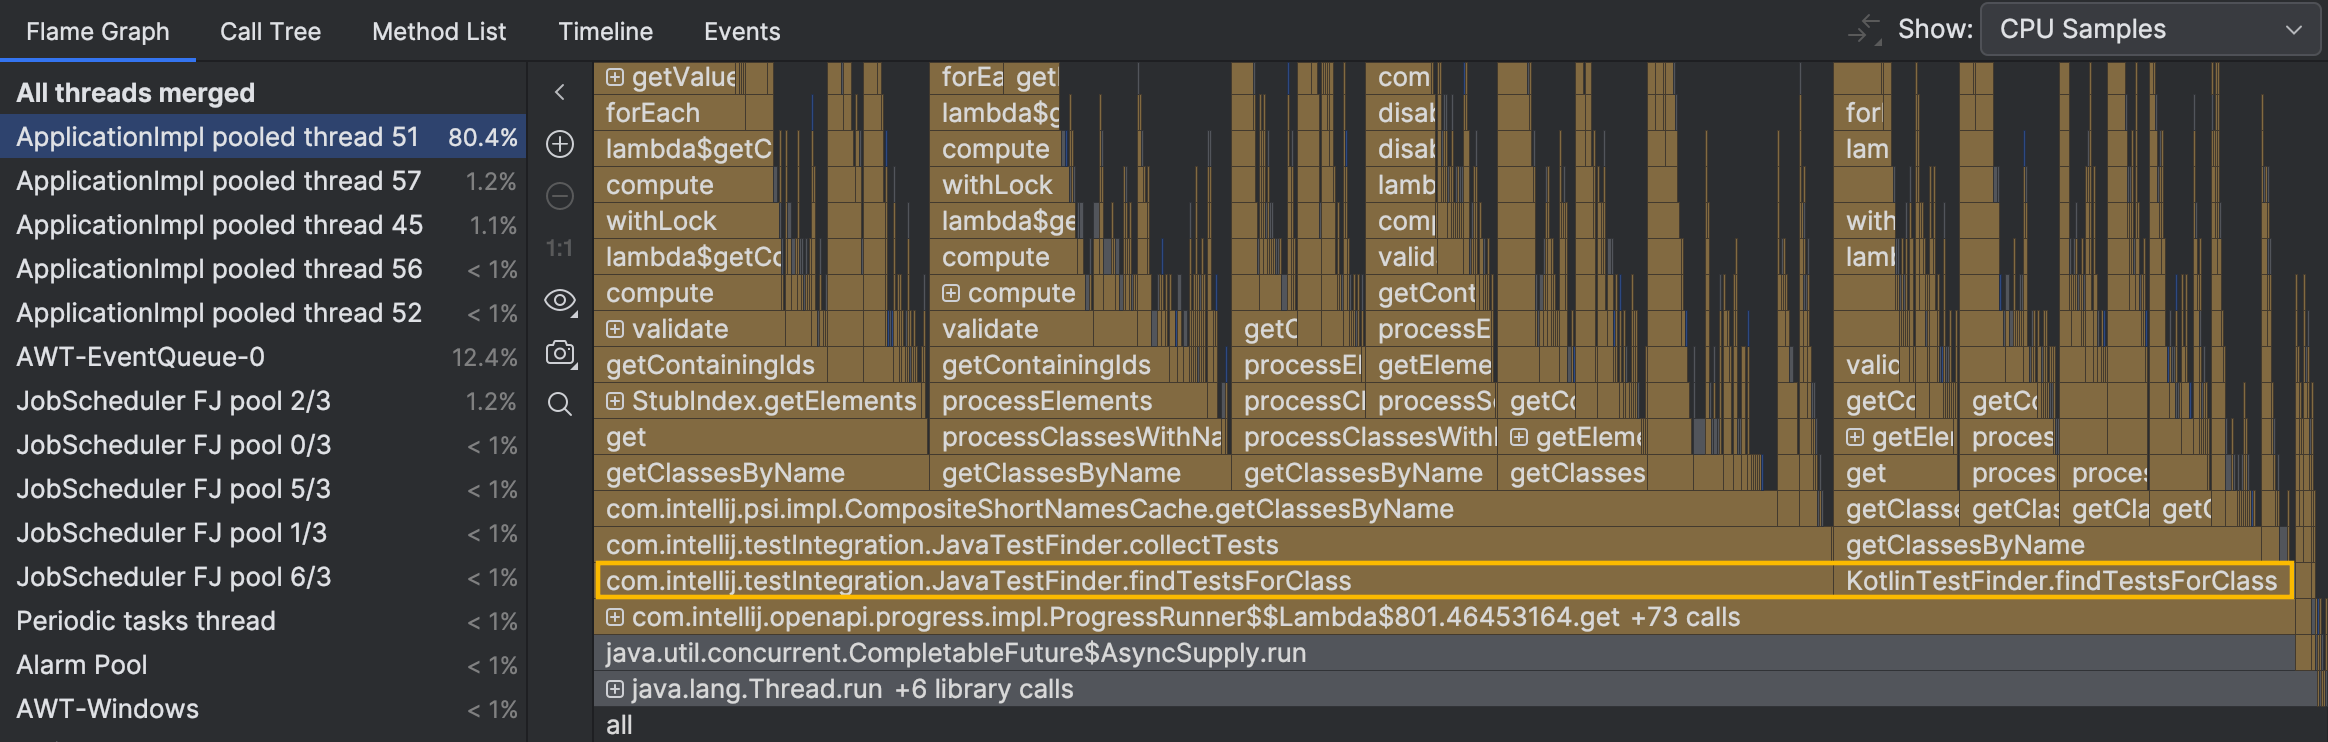
The methods that might be of interest to us,
JavaTestFinder.findTestsForClass() and KotlinTestFinder.findTestsForClass() ,
are right at the bottom of the graph.
We don’t take into account the folded methods below them, as they don’t have significant self-time or branching.
They control flow rather than perform intense computations.
To verify whether these methods are indeed related to the slowdown,
we can profile a non-problematic case:
search for tests for a class with a more realistic name, for example,
ClassWithALongerName .
Then, we’ll see what happens to these methods using the diff view.
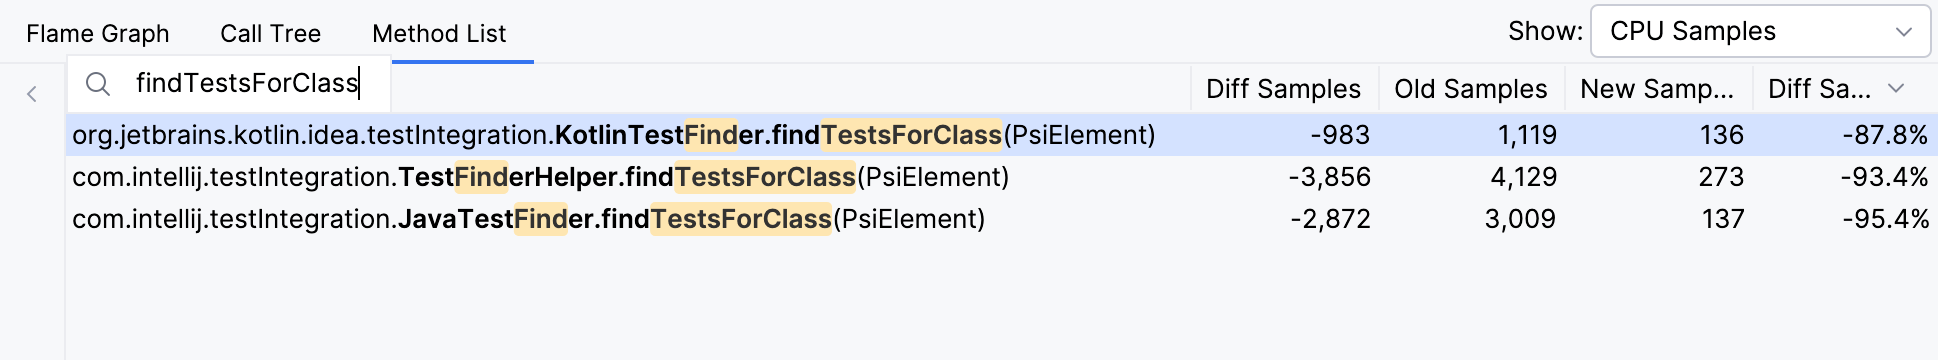
The newer snapshot contains 93-95% fewer samples
with JavaTestFinder.findTestsForClass()
and KotlinTestFinder.findTestsForClass() .
The runtime of the other methods doesn’t differ that much.
It seems like we are going in the right direction.
The next question is why that happens. Let’s try to find that out with the debugger.
Why such huge difference?
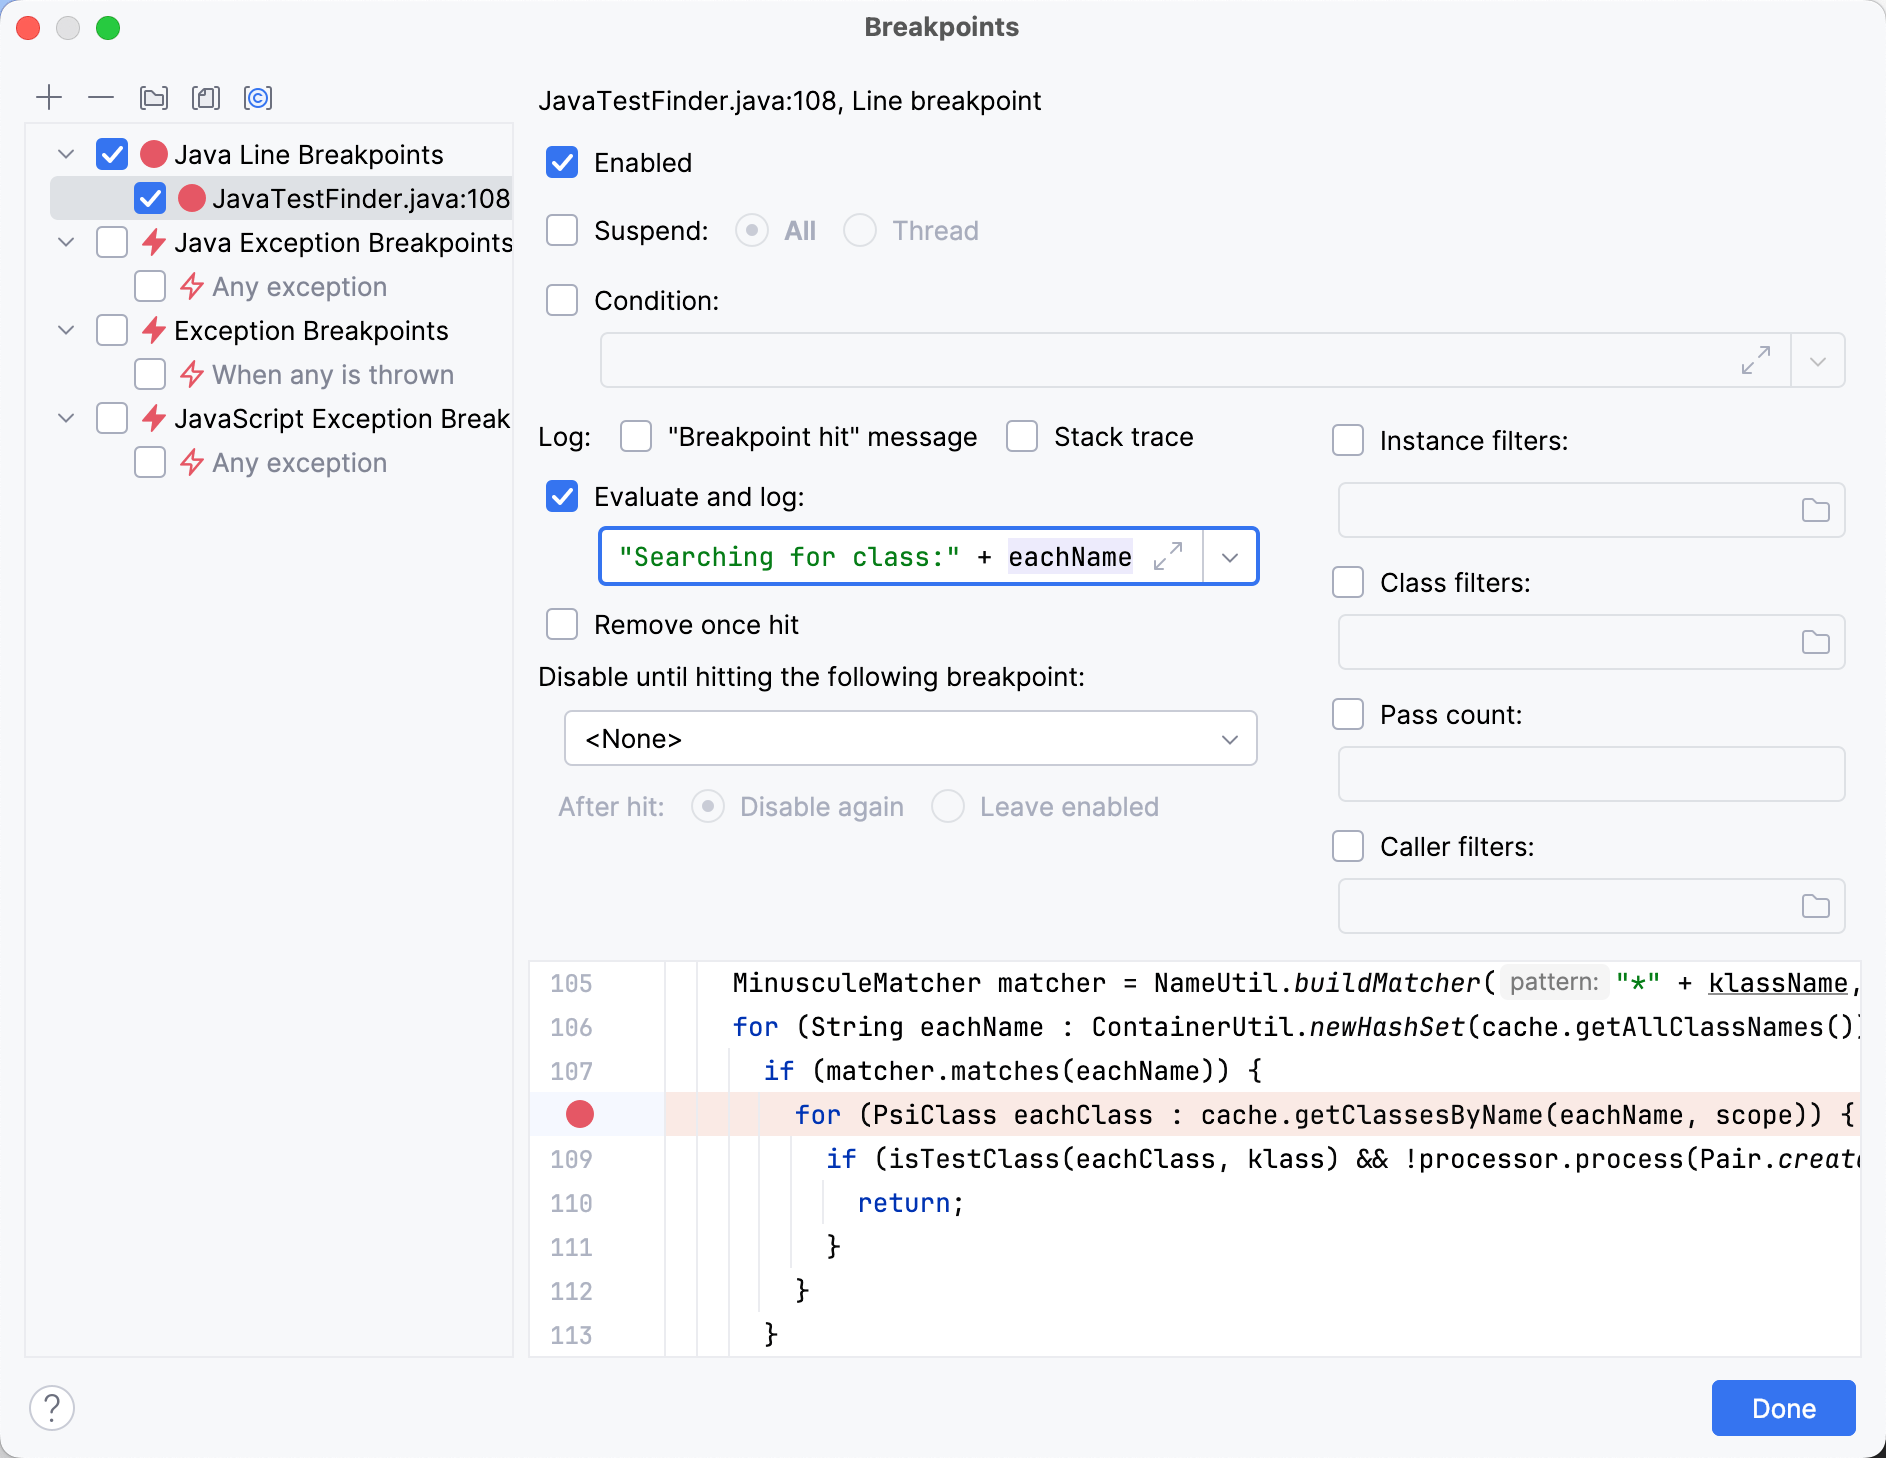
Setting a breakpoint in findTestsForClass() and a little bit
of stepping through the code bring us to the following point:
MinusculeMatcher matcher = NameUtil.buildMatcher("*" + klassName, NameUtil.MatchingCaseSensitivity.NONE);
for (String eachName : ContainerUtil.newHashSet(cache.getAllClassNames())) {
  if (matcher.matches(eachName)) {
    for (PsiClass eachClass : cache.getClassesByName(eachName, scope)) {
      if (isTestClass(eachClass, klass) && !processor.process(Pair.create(eachClass, TestFinderHelper.calcTestNameProximity(klassName, eachName)))) {
        return;
      }
    }
  }
}
The code is filtering the short names that are currently in the cache using a regular expression. For each of the resulting strings, it searches the corresponding classes.
By logging the class names after the condition, we get all the classes that pass it.
When I executed the program, it logged about 25000 classes, a surprisingly large number for an empty project!
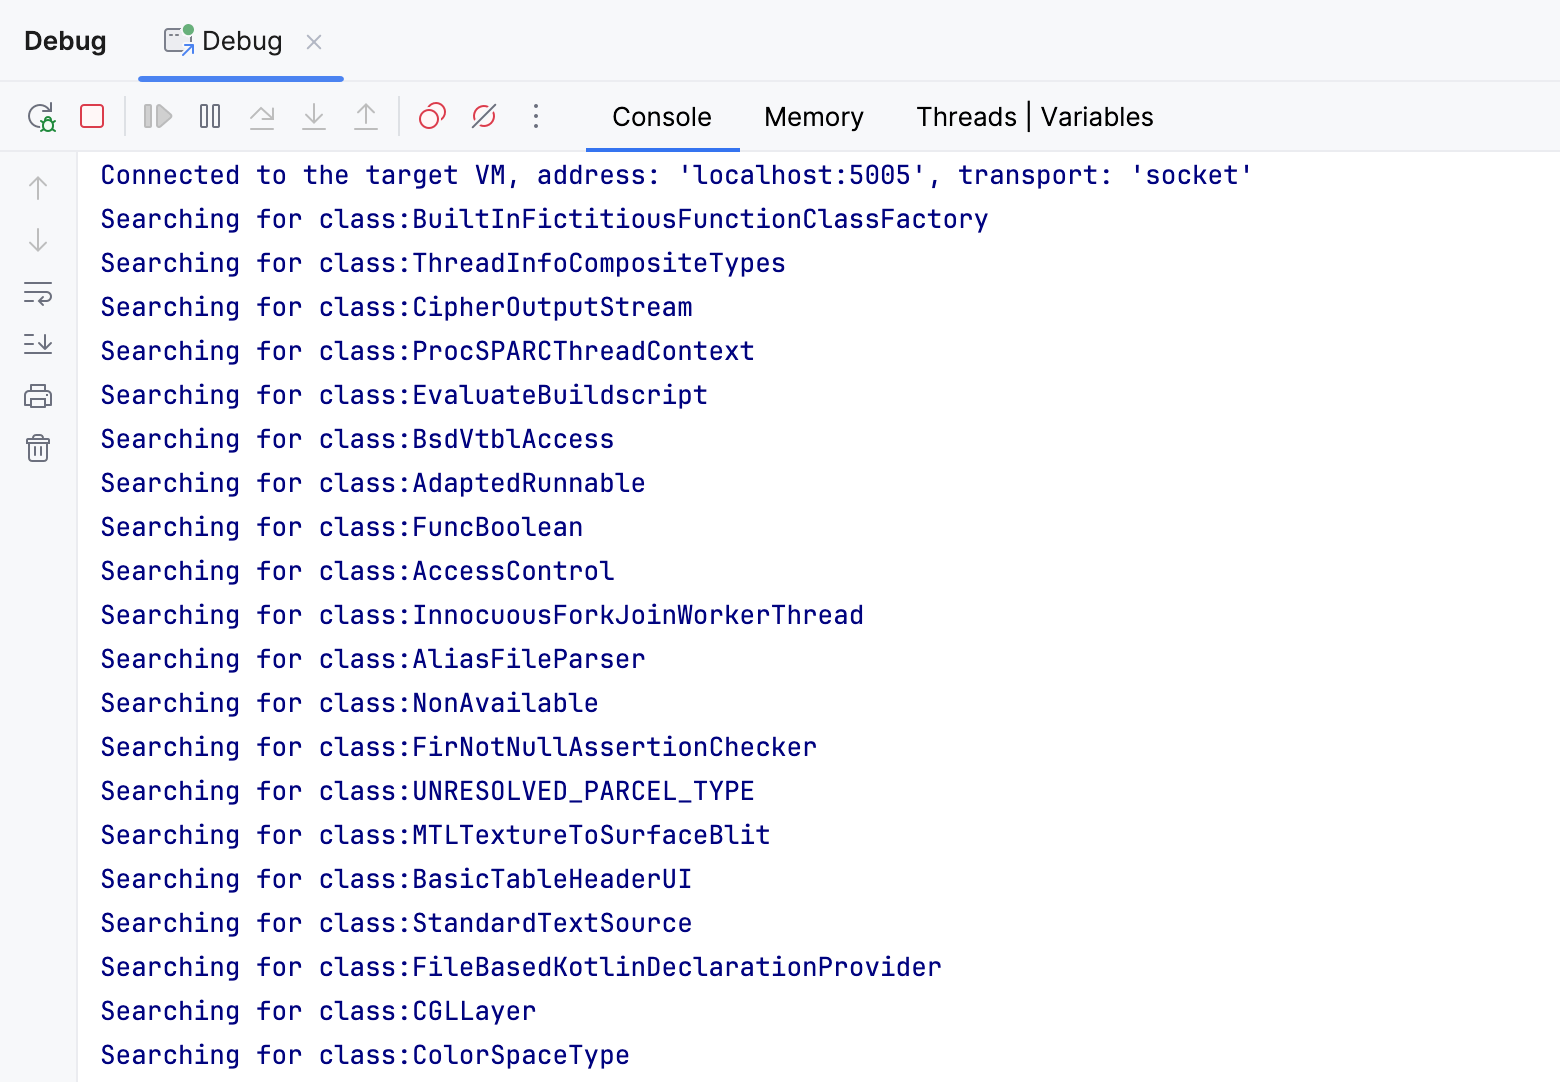
The logged class names are clearly coming from somewhere else, not my ‘Hello World’ project.
The mystery is solved: IntelliJ IDEA takes so long to find tests for class A ,
because it checks all the cached classes, including dependencies, JDKs, and even classes from other projects.
Too many of them pass the filter because they all have
the letter A in their names.
With longer and more realistic class names, this inefficiency would have remained unnoticed,
just because most of these names would have been filtered out by the regex.
The fix?
Unfortunately, I couldn’t find a simple and reliable fix for this issue. One potential strategy would be to exclude dependencies from the search scope. This looks viable at first glance, but there’s a possibility that dependencies might contain tests. This doesn’t happen too often, but still, this approach would break the feature for such dependencies.
An alternative approach is to introduce the *.java file mask, which would filter out compiled classes.
While working well with Java, it becomes problematic for tests written in other languages, such as Kotlin.
Even if we add all the possible languages, this feature will just silently fail for newly supported ones,
resulting in added overhead for maintenance and debugging.
Regardless of the approach, the fix warrants a post of its own, so we are not implementing it right now. What we did, however, is discover the root cause of a slowdown, which is exactly why one would use a profiler.
Share the snapshot
Before wrapping up, there’s one more thing worth discussing. Did you notice I used a snapshot taken on a different computer? Furthermore, the snapshot wasn’t just from a different machine. The operating system and version of IntelliJ IDEA were also different.
One beautiful thing that is often overlooked about the profiler is the ease of sharing the data. The snapshot is written to a file, which you can send to someone else (or receive from someone). In contrast with other tools, such as the debugger, you don’t need a complete reproducer to start with the analysis. In fact, you don’t even need a compilable project for that.
Don’t take my word for it; give it a try yourself. Here’s the snapshot: idea64_exe_2024_07_22_113311.jfr