AI Skill for Debugging Flaky Tests
Other languages: EspañolFrançaisDeutsch日本語한국어Português中文
If you’ve been connected to the internet for a while, you’ve surely heard of AI agent skills. They teach your agent to do this and that. You might have even used or written a couple of them yourself.
If you aren’t yet familiar with them, the idea is simple: instead of prompting instructions for a specific task each time, you define them once and reuse them later. A skill is an AI equivalent of a knowledge base article: a plain text document that lives in a discoverable location and describes steps, a set of conventions, or domain-specific knowledge.
Most skills you see in the wild are for simple things like enforcing code style or commit message conventions. But they can be much more powerful than that. In this article, we’ll combine AI skills, good old developer tools, and a bit of creative thinking to address a notoriously challenging task: making AI deterministically find the root cause of flaky tests.
The problem
Quoting the TeamCity CI/CD guide:
Flaky tests are defined as tests that return both passes and failures despite no changes to the code or the test itself.
Flakiness undermines the whole point of tests: when a test fails, you can’t tell whether something is actually broken. You can’t fully rely on the test results, and at the same time, you can’t ignore them. This wastes both human and infrastructure resources.
And as if the underlying bugs weren’t difficult enough on their own, flaky tests often have this property of failing once in several thousand runs, making them extremely hard to reproduce and debug.
Example project
For the example project, let’s take the webshop demo from this article: Your Programs Are Not Single-Threaded. It is a Spring Boot project, in which one of the services has a TOCTOU (time-of-check to time-of-use) problem: it checks a condition and then acts on it, but another thread can change the state in between. In this particular case, it may sometimes cause duplicate invoice numbers and also makes the corresponding test flaky.
Here’s the problematic test:
@SpringBootTest
class InvoiceServiceTest {

    @Autowired
    private OrderService orderService;

    @Test
    void firstTwoOrdersGetInvoiceNumbersOneAndTwo() {
        CompletableFuture<Invoice> alice = CompletableFuture.supplyAsync(
                () -> orderService.checkout("Alice", BigDecimal.TEN));
        CompletableFuture<Invoice> bob = CompletableFuture.supplyAsync(
                () -> orderService.checkout("Bob", BigDecimal.TEN));

        String num1 = alice.join().getInvoiceNumber();
        String num2 = bob.join().getInvoiceNumber();

        assertEquals(Set.of("INV-00001", "INV-00002"), Set.of(num1, num2));
    }
}
The test creates two orders concurrently and checks that the resulting invoices
get numbers INV-00001 and INV-00002 .
Because of a bug in InvoiceService ,
it can either pass or fail randomly.
If you’re using IntelliJ IDEA, you can test whether a test is actually flaky by using the Run until failure option in the test runner. Leave the suspect spinning for some time and see if it eventually fails.
If we knew nothing about the underlying bug, and only had the test, is there a tool that could help us find the root cause? Or can we make one ourselves? Furthermore, could we delegate both building and using the tool to AI?
The intuition
Let’s come up with some intuition for this class of problem.
To produce two kinds of results, the execution
must follow different code paths.
The difference might be minimal, possibly just one extra method call
or one if branch taken instead of another.
But it has to be there; otherwise, the result would be consistent.
So, if we could record the code path for a passing run and a failing run
and then compare them, the diff should at least point us in the right direction.
And ideally, by following the call tree, we could find the place where execution splits.
This line must be exactly where the flakiness originates.
Does this reasoning make sense? Let’s put it to the test.
Build the tools
What tool can we use for recording code paths? While not designed specifically for tracing, test coverage can give us the information we’re after.
There are a couple of Java coverage tools to choose from, such as JaCoCo and IntelliJ IDEA’s coverage tool. We’ll go with IntelliJ IDEA’s, because it includes the hit counting feature. We may need this extra granularity because the flakiness might stem not only from what is executed, but also how many times.
Run coverage from the command line
IntelliJ IDEA’s coverage tool has a familiar UI, but we need a way to launch it programmatically. Fortunately, coverage can also be collected from the command line by attaching the coverage agent to the JVM via Maven Surefire:
mvn surefire:test \
  -Dtest=com.example.webshop.service.InvoiceServiceTest \
  "-DargLine=-Didea.coverage.calculate.hits=true \
    -javaagent:$AGENT_JAR=$IC_FILE,true,false,false,true,com.example.webshop.*"
The -Didea.coverage.calculate.hits=true flag
tells the agent to record invocation counts per line rather than just a boolean hit/not-hit mask.
After the test finishes, the results are written to a binary .ic file.
So far so good, but we need the report in a human (and AI)-readable format.
Add text output
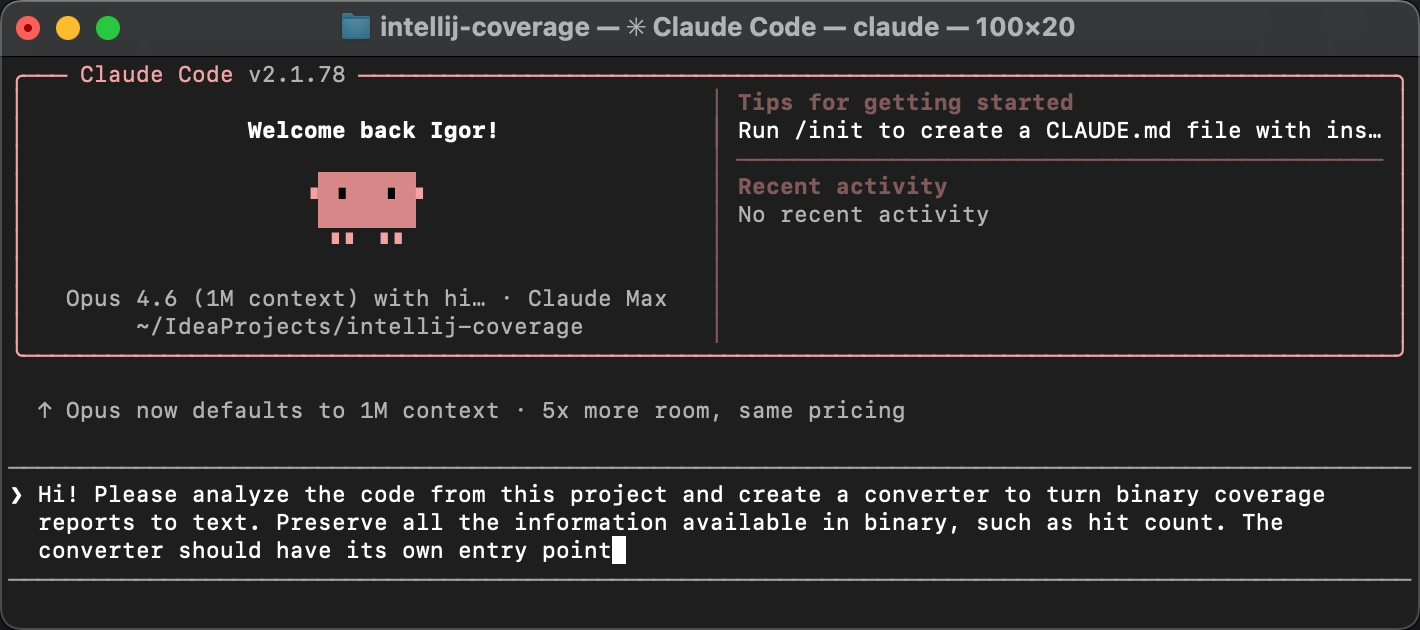
Luckily, the IntelliJ coverage agent is open-source. Let’s clone the project and ask AI to add a text reporter that converts binary reports to plain text.
The agent creates a new class called TextCoverageStatistics .
After we build the project and run the reporter against our .ic file,
we get something like this:
=== Coverage Summary ===

  Instructions: 236/618  38,2%
  Branches    : 0/20   0,0%
  Lines       : 56/150  37,3%
  ...

=== Per-Class Coverage ===

Class                                                           Lines    Line%  Methods    Meth%
--------------------------------------------------------------------------------------------
...
com.example.webshop.service.InvoiceNumberGenerator              4/4    100,0%    2/2    100,0%
com.example.webshop.service.InvoiceService                     10/10   100,0%    3/3    100,0%
com.example.webshop.service.OrderService                        6/6    100,0%    2/2    100,0%
...
The first part of the report gives a high-level overview: how many lines, branches, and methods were covered across the entire project. Below that, there’s a per-class breakdown showing the same metrics for each class individually.
Then it is followed by per-line hit counts for each class:
--- com.example.webshop.service.InvoiceService ---
  Line       Hits  Branch
  19            2
  20            1
  22            2
  23            2
  24            2
  ...
For every line that the coverage agent instrumented, we see how many times it was executed and whether any branches were taken. The actual report is longer, but you get the idea. Now we have a text representation of which lines were executed, and exactly how many times.
This is the raw material we need for the diff. So far, so good!
Diff the reports
Supposedly, the obtained reports contain the necessary information, and a very determined developer could peruse them and find the bug. But we’re not here for mundane tasks like that, right?
Let’s upgrade the tool so that it gets multiple report variations and presents the diff. The most controllable way would be to do one “brick” at a time, but I think we’re safe to delegate the entire thing to AI here, including the automation:
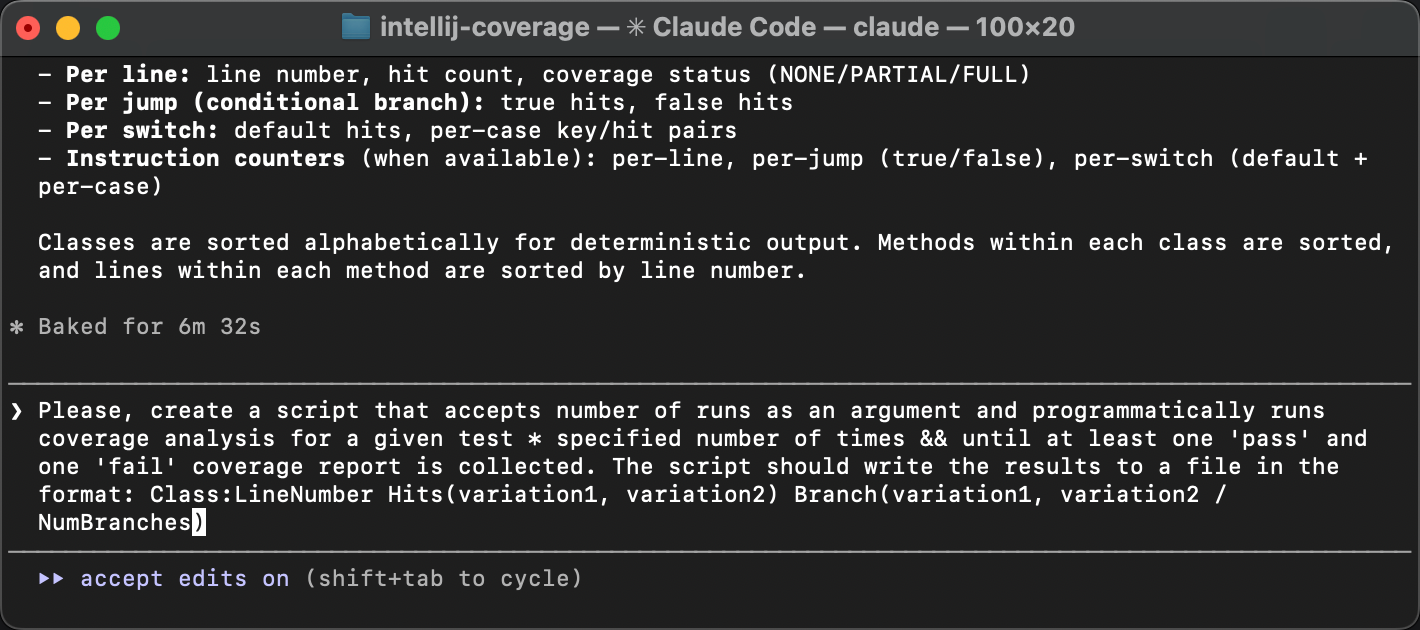
The resulting script runs the test in a loop until both of the following happen:
- we get at least one passing and one failing run.
- the specified number of runs have passed.
Both conditions are important because test failures can be very rare, and the specified number of runs might not be enough. At the same time, there can be finer grained variations within pass and fail runs, so we might want to catch those too.
After the reports are collected, the script summarizes the lines that have variations between the runs. Here’s what it looks like:
Collected 20 runs: 12 pass, 8 fail

Lines that vary across runs:

  Invoice:29                           Hits(1,2)
  Invoice:31                           Hits(1,2)
  Invoice:32                           Hits(1,2)
  InvoiceNumberGenerator:15            Hits(1,2)
  InvoiceService:19                    Hits(1,2)  Branch(1/2)
  InvoiceService:20                    Hits(1,2)
  InvoiceService:22                    Hits(1,2)
  InvoiceService:24                    Hits(1,2)
All variations have the same pattern: the difference is not which lines were executed, but how many times. As we expected, the hit counting feature of IntelliJ IDEA’s coverage agent proved useful!
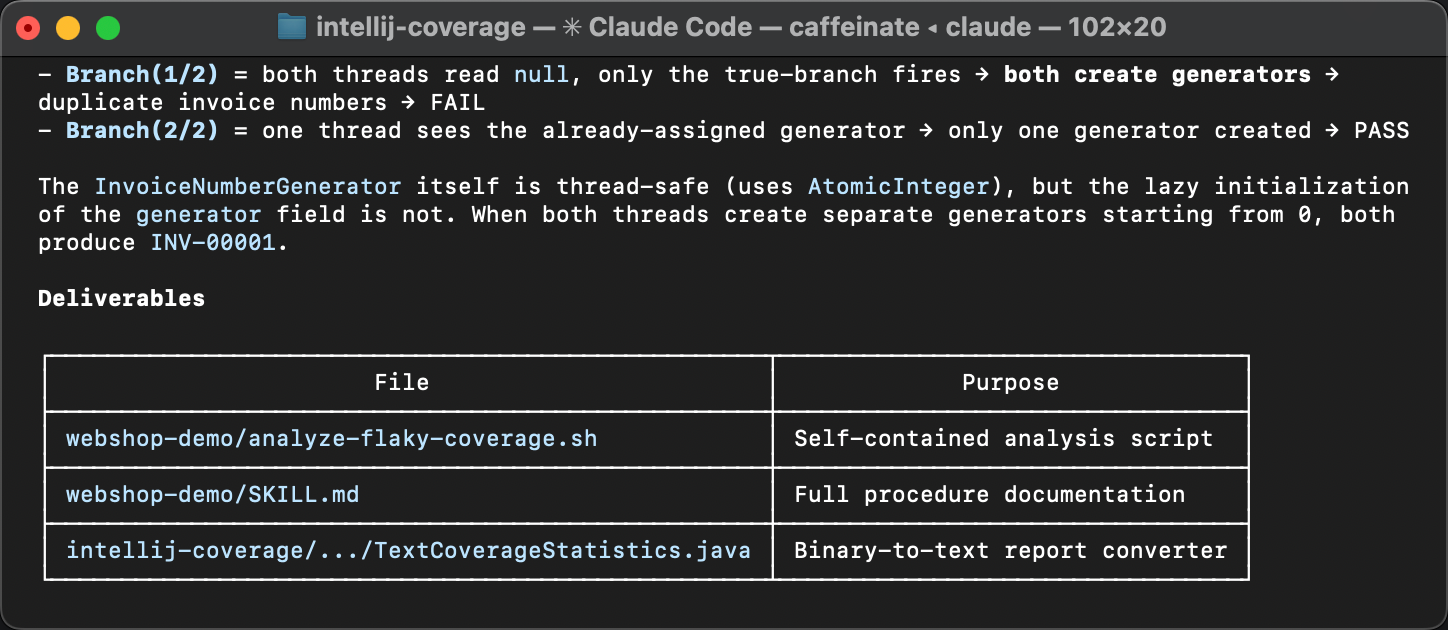
The varying lines point at a lazy initialization block in InvoiceService
and its downstream effects in InvoiceNumberGenerator
and Invoice .
The variation in hit counts means that the initialization sometimes runs more than once,
which shouldn’t happen. That’s exactly where the flakiness comes from.
If you missed the article that describes the problem, here’s why double initialization causes this bug.
The createGenerator() method queries the database
for the last used invoice number and creates a counter starting from that value.
When two threads both enter the if (generator == null) block
before either finishes, each reads the same number from the database
and creates its own generator starting from the same value.
The result is duplicate invoice numbers.
The coverage diff has pointed us at the very same TOCTOU race discussed in more detail in the previous article. But, what is novel in our current approach is that it doesn’t solely rely on human expertise and is easily accessible for AI.
Turning it into a skill
Now, I’d say that AI-assisted modifications to open-source tools to help you solve the task at hand, all within minutes, are amazing on their own. But let’s keep our eyes on the bigger picture.
Here’s what we’ve done so far: we started with an intuition: flaky tests take different code paths, and coverage analysis can reveal where they diverge. Then we turned that intuition into a concrete, repeatable procedure. Does this warrant a knowledge base article, or an AI agent skill, perhaps? Yes!
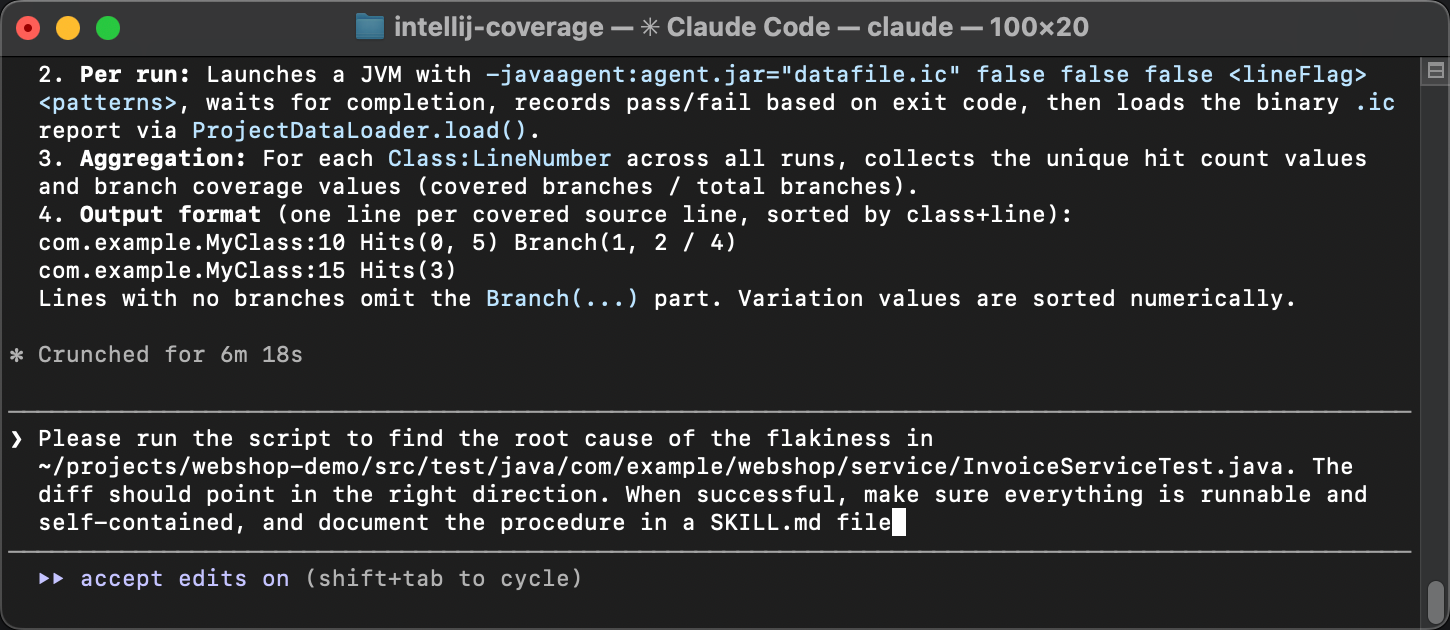
In the same agent session, let’s ask the agent to:
- Make sure all the scripts are self-contained and runnable.
- Document the entire procedure in a
SKILL.mdfile, step by step, so that another agent can follow it without any prior context.
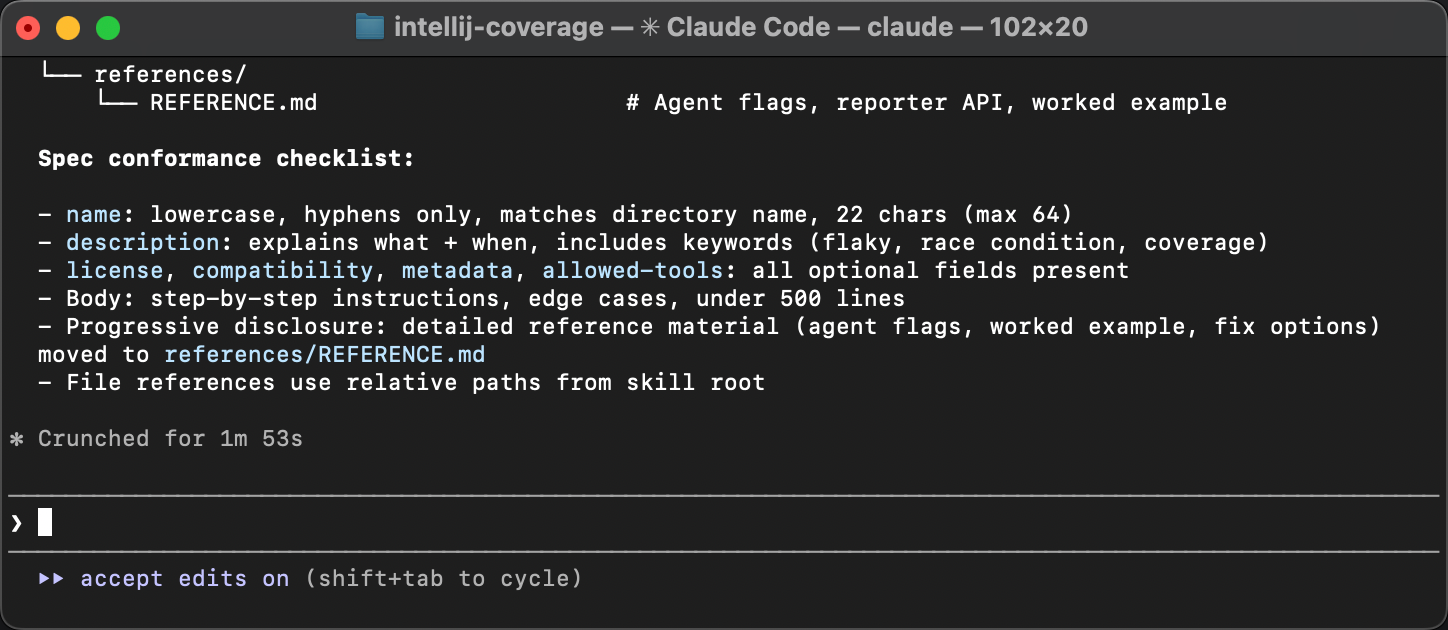
The agent packages everything and writes a guide that describes when to apply the skill, what tools are needed, and what steps to follow.
The only follow-up during review was to align the skill with the specification. The original skill lacked meta in frontmatter. Agents are good at sorting out skills that omit minor details, but meta is important for discoverability. Without it, a skill might not be picked up by an agent in the first place.
Testing the skill
To verify that the skill actually works, let’s start a fresh agent session.
No warm-up, no hints. Instead, let’s deliberately phrase it in a very general way,
something like Find and fix the cause of flakiness in InvoiceServiceTest.
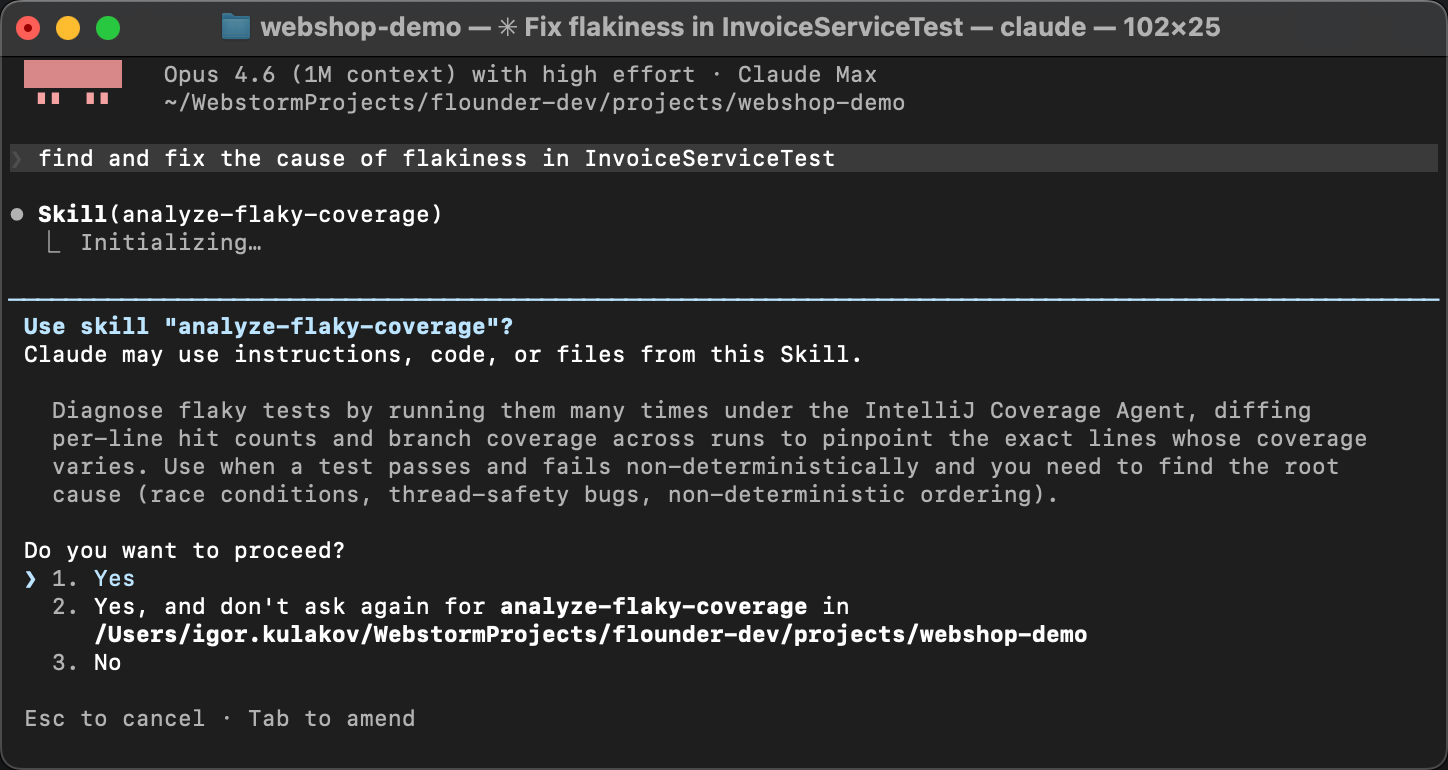
The agent matches the skill description from SKILL.md with the problem description,
discovers the instructions, and executes them: it runs the coverage script, reads the diff,
and identifies the race condition.
Instead of guesswork, it follows the established steps
and arrives at the same conclusion every time. As deterministic as generative AI can get!
Summary
The changes that we’ve made to the coverage agent are already published with the new version 1.0.774. And the skill is available here.
In this article, we started with an intuition about flaky tests, built custom tooling around an open-source coverage agent, used it to find a race condition, and packaged the entire procedure into a reusable AI skill. You can use this skill for finding flaky tests in your own projects, but I hope this post conveys the bigger idea.
AI skills allow you to teach agents to solve virtually anything, as long as you can stack text interfaces together. Many hard programming problems can be broken down into simpler ones and solved using familiar tools. And with AI orchestrating all this, we can even make the process enjoyable. As was the case long before AI, curiosity is the only real prerequisite.
Happy debugging!